UNITED STATES
SECURITIES AND EXCHANGE COMMISSION
Washington, D.C. 20549
FORM
(Mark One)
For the fiscal year ended
or
For the transition period from _____ to _____
Commission file number
(Exact name of registrant as specified in its charter)
| (State or other jurisdiction of | (I.R.S. Employer Identification No.) | |
| Incorporation or organization) | ||
| (Address of principal executive offices) | (Zip Code) |
Registrant’s telephone number, including
area code
Securities registered pursuant to Section 12(b) of the Act:
| Title of each class | Trading Symbol(s) | Name of each exchange on which registered |
| The (Nasdaq Global Market) |
Securities registered pursuant to Section 12(g) of the Act:
Title of each class
None
Indicate by check mark if the registrant is a
well-known seasoned issuer, as defined in Rule 405 of the Securities Act. Yes ☐
Indicate by check mark if the registrant is not
required to file reports pursuant to Section 13 or 15(d) of the Act. Yes ☐
Indicate by check mark whether the
registrant (1) has filed all reports required to be filed by Section 13 or 15(d) of the Securities Exchange Act of 1934 during the
preceding 12 months (or for such shorter period that the registrant was required to file such reports), and (2) has been subject to
such filing requirements for the past 90 days.
Indicate by check mark whether the
registrant has submitted electronically every Interactive Data File required to be submitted pursuant to Rule 405 of Regulation S-T
(§232.405 of this chapter) during the preceding 12 months (or for such shorter period that the registrant was required to
submit such files).
Indicate by check mark whether the registrant is a large accelerated filer, an accelerated filer, a non-accelerated filer, a smaller reporting company, or an emerging growth company. See the definitions of “large accelerated filer,” “accelerated filer,” “smaller reporting company,” and “emerging growth company” in Rule 12b-2 of the Exchange Act.
| Large accelerated filer ☐ | Accelerated filer ☐ |
| Smaller reporting company
| |
| Emerging growth company |
If an emerging growth company, indicate by check mark if the registrant has elected not to use the extended transition period for complying with any new or revised financial accounting standards provided pursuant to Section 13(a) of the Exchange Act. ☐
Indicate by check mark whether the registrant has filed a report on and attestation to its management’s assessment of the effectiveness of its internal control over financial reporting under Section 404(b) of the Sarbanes-Oxley Act (15 U.S.C. 7262(b)) by the registered public accounting firm that prepared or issued its audit report. ☐
Indicate by check mark whether the registrant
is a shell company (as defined in Rule 12b-2 of the Act). Yes ☐
As of June 30, 2021, the aggregate market
value of shares held by non-affiliates of the registrant (based upon the closing price of such shares on the OTCQB Market on June
30,2021) was $
The number of shares outstanding of the registrant’s common stock, $0.001 par value, outstanding as of March 8, 2022: .
DOCUMENTS INCORPORATED BY REFERENCE
None.
TABLE OF CONTENTS
| i |
FOCUS UNIVERSAL INC.
FORWARD-LOOKING STATEMENTS
This Annual Report contains forward-looking statements. Forward-looking statements are projections of events, revenues, income, future economic performance or management’s plans and objectives for our future operations. In some cases, you can identify forward-looking statements by terminology such as “may,” “should,” “expects,” “plans,” “anticipates,” “believes,” “estimates,” “predicts,” “potential” or “continue” or the negative of these terms or other comparable terminology. These statements are only predictions and involve known and unknown risks, uncertainties and other factors, including, but not limited to, the risks in the section entitled “Risk Factors” and the risks set out below, any of which may cause our or our industry’s actual results, levels of activity, performance or achievements to be materially different from any future results, levels of activity, performance or achievements expressed or implied by these forward-looking statements. These risks include, by way of example and not in limitation:
| · | the uncertainty of profitability based upon our history of losses; |
| · | risks related to failure to obtain adequate financing on a timely basis and on acceptable terms; |
| · | risks related to our international operations and currency exchange fluctuations; and |
| · | other risks and uncertainties related to our business plan and business strategy. |
This list is not an exhaustive list of the factors that may affect any of our forward-looking statements. These and other factors should be considered carefully, and readers should not place undue reliance on our forward-looking statements. Forward-looking statements are made based on management’s beliefs, estimates and opinions on the date the statements are made, and we undertake no obligation to update forward-looking statements if these beliefs, estimates and opinions or other circumstances should change. Although we believe that the expectations reflected in the forward-looking statements are reasonable, we cannot guarantee future results, levels of activity, performance or achievements. Except as required by applicable law, including the securities laws of the United States, we do not intend to update any of the forward-looking statements to conform these statements to actual results.
Our financial statements are stated in United States dollars (US$) and are prepared in accordance with United States Generally Accepted Accounting Principles. All references to “common stock” refer to the common shares in our capital stock.
As used in this annual report, the terms “we,” “us,” “our,” the “Company” and “Focus Universal” mean Focus Universal Inc. unless otherwise indicated.
| ii |
PART I
Item 1. BUSINESS
Company Background.
Focus Universal Inc. (the “Company,” “we,” “us,” or “our”) is a Nevada corporation. We are based in the city of Ontario, California, and were incorporated in Nevada in 2012. In December of 2013, we filed an S-1 registration statement that went effective on March 14, 2014. From March 14, 2014 through August 30, 2021, our securities traded on the OTCQB Market. From August 31, 2021 through January 27, 2022, our securities traded on the Nasdaq Capital Market. From January 28, 2022, our securities have traded on the Nasdaq Global Market.
Our website is www.focusuniversal.com. Our website and the information contained therein or connected thereto are not intended to be incorporated into this report.
We have developed five proprietary platform technologies that we believe solve the most fundamental problems plaguing the internet of things (“IoT”) industry by: (1) increasing the overall degree of chip integration capabilities by shifting integration from the component level directly to the device level; (2) creating a faster 5G cellular technology by using ultra-narrowband technology; (3) leveraging ultra-narrowband power line communication (“PLC”) technology; (4) developing a natural integrated programming language (“NIPL”) applied to software development, which generates a user interface through machine auto generation technology; and (5) developing a universal smart instrumentation platform (“USIP”).
Index of Key Technical Abbreviated Terms
| Abbreviation | Full Term |
| 5G | Fifth Generation Mobile Wireless Telecommunications Network |
| FSK | Gaussian Frequency Shift Keying |
| HANs | Home Area Networks |
| IC | Integrated Chip |
| IoT | Internet of Things |
| LTE Networks | Long-Term Evolution Networks |
| MOS Transistor | Metal-Oxide-Silicon Transistor |
| PLC | Power Line Communication |
| UNB | Ultra-narrowband |
| USIO | Universal Smart Instrumentation Operating System |
| USIP | Universal Smart Instrumentation Platform |
| 1. | Our goal is to increase the overall degree of chip integration capabilities by shifting integration from the component level directly to the device level. |
We have developed an innovative and proprietary “device on a chip” (“DoC”) technology, which combines the required electronic circuits of various integrated circuit components onto a single, integrated chip (“IC”) and pushes beyond the limits of current integrated chip. Our DoC technology works as a single component but is capable of handling entire IoT device functions (excluding sensors and architecture-specific components). Our DoC technology includes both the hardware and software, uses less power compared to traditional IoT devices, with better performance, includes smaller overall devices, and offers greater reliability in spite of decreasing the number of interconnections between components. We believe that incorporating our DoC technology into our product offering, will simplify the manufacturing process, lowering our costs and allowing us to achieve a faster time-to-market, when compared to our competitors’ who only manufacture and sell multi-chip devices. Our planned DoC technology allows devices to achieve interoperability with one another and are interchangeable, both features where traditional IoT devices fall short.
| 1 |
Our research and development suggests that the existing IC integration in IoT devices is mainly focused on hardware-to-hardware integration, not incorporating software solutions. This lack of incorporating software under a common operating system, application software, and extra interface into ICs, limits IC integration to the component level. Software is a critical component in electronics, and the more tightly integrated the software, the better the power and performance. Software also adds an element of flexibility and allows multiple discrete ICs, which in the past were unable to be further integrated into a single IC.
Currently, ICs integration requires the development and manufacture of customized hardware and software. As a result, IC fabrication is too expensive to manufacture on a large scale. IC is ideally designed for products that are intended for mass production to keep manufacturing costs low by producing uniform products using repetitive and standardized processes. Product standardization has become a major bottleneck in device-level IC fabrication because most devices are custom-designed and manufactured.
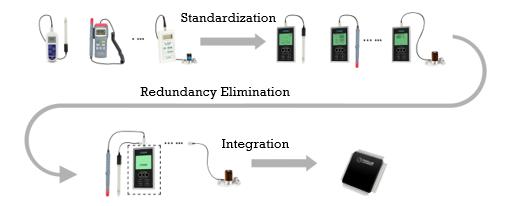
The Universal Smart Instrumentation Platform (“USIP”) we developed is a standardized, universal hardware and software integration platform that provides a universal common foundation for what we anticipate will be thousands of IoT and standalone devices. The electronic design and production starts from a 90% completed common foundation, our USIP, instead of the individual components that necessitate the current method of building each standalone instrument from scratch. USIP allows ICs to be integrated from the component level up to the device level, which pushes the frontier of semiconductor technology beyond Moore’s Law. Our USIP also eliminates redundant hardware and software and results in significant cost savings and production efficiency.
Figure 1. From USIP to device level integrated circuits (“IC”).
| 2. | Creating a faster 5G cellular technology by using ultra-narrowband technology. |
Fifth-generation (“5G”) telecommunications networks will revolutionize the digital economy by enabling new applications that depend on ultra-fast communications on an industrial scale. 5G promises to deliver an improved end-user experience by offering new applications and services through gigabit speeds and significantly improved performance and reliability. 5G will build on the successes of 2G, 3G, and 4G mobile networks, which have transformed society, supporting new services and new business models. 5G provides an opportunity for wireless operators to move beyond providing connectivity services to developing rich solutions and services for consumers and industries across a wide range of sectors at an affordable cost. 5G is an opportunity to implement wired and wireless converged networks and offers particular opportunities to integrate network management systems. The United States and China are in a race to deploy 5G wireless networks, and the country that gets there first will lead in standard-setting, patents, and the global supply chain. A World Economic Forum report stated that by 2035 5G networks would contribute $13.2 trillion in economic value globally and generate 22.3 million jobs in the 5G global value chain from direct network investments and residual services.1 5G networks and their related applications are expected to add three million jobs and $1.2 trillion to the economy in the U.S.2
______________
1 World Economic Forum, January 2020 “The Impact of 5G: Creating New Value across Industries and Society,” available at: http://www3.weforum.org/docs/WEF_The_Impact_of_5G_Report.pdf (last accessed January 10, 2022).
2 https://www.marketsandmarkets.com/Market-Reports/power-line-communication-plc-market-912.html (last accessed on January 10, 2022).
| 2 |
Though 5G offers a significant increase in speed and bandwidth over previous generation telecommunication networks, its more limited range for high-speed internet will require further infrastructure investments. A 5G network requires spectrum across low, mid, and high spectrum bands to deliver widespread coverage and support a wide range of use cases.3 A low-band cell site can cover hundreds of square miles and deliver a downlink data rate in the range of 30-250 Mbps.4 Mid-band frequencies (2.5/3.5Ghz) can also travel fairly long distances but can carry a lot more data than low-band cell sites.5 Mid-band 5G base stations can transmit and receive high-capacity signals over fairly large areas. They can represent an ideal mix of performance—including some networks providing download speeds around 100-900 Mbps—for the bulk of 5G traffic in metropolitan areas.6 High-band 5G uses millimeter-wave (mmWave) frequency bands. Despite receiving plenty of publicity, high-band is actually a very specialized part of the 5G offering.7 Functioning over a shorter radius, it’s particularly useful in urban areas and busy venues like stadiums and shopping malls.8 With the potential to offer data rates of up to 10 Gbps, high-band 5G is already being deployed in several major cities. Download speeds for carriers’ high-band 5G can sometimes clock in around 450 Mbps, with peak speeds of nearly 1 Gbps, and upload speeds near 50 Mbps.9
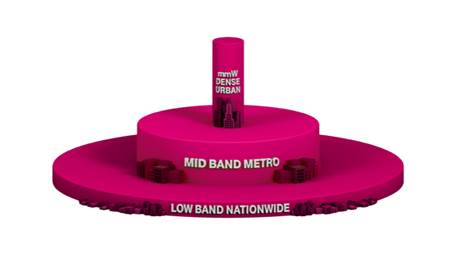
High-band, mmWave spectrum is used primarily for urban and dense urban markets. The characteristics of high-band, mmWave spectrum is that it is very wide and provides a significant increase in capacity. Because of the greater spectrum width, speed is increased, and transmission latency is reduced. However, the drawback is that high-band spectrum does not propagate over a large coverage area. For example, a 28 GHz mmWave spectrum can only travel 500 feet.10
Low-band frequencies can travel long distances and penetrate buildings but can only carry a limited amount of data. High-band frequencies can carry a substantial amount of data, but due to their shorter wavelength, they travel shorter distances and are more susceptible to buildings and trees blocking the signal.11
_______________
3 Horwitz, Jeremy (December 10, 2019). “The definitive guide to 5G low, mid, and high band speeds.” VentureBeat online magazine (available at: https://venturebeat.com/2019/12/10/the-definitive-guide-to-5g-low-mid-and-high-band-speeds/ (Last accessed January 10, 2022)).
4 Id.
5 Id.
6 Id.
7 See “5G Rollout—Beyond the Hype.” Parsons Cyber Blog, June 16, 2020 (“As a result, 5G base stations must be positioned as close as a third of a mile, whereas 4G base stations can provide coverage of 20 to 45 miles. This limitation becomes especially acute in more rural and/or remote areas, wherein 5G networks become impractical”) (available at: https://www.parsons.com/2020/06/5g-rollout-beyond-the-hype/ (last accessed, April 15, 2021)).
8 Id.
9 https://www.t-mobile.com/business/resources/articles/benefits-of-the-5g-spectrum-for-businesses (last accessed January 5, 2022).
10 https://dgtlinfra.com/american-tower-5g-deployed-in-layers-different-spectrum-bands/ (last accessed January 5, 2022).
11 https://www.md7.com/perspectives/infrastructure-challenges-of-5g-frequency/ (last accessed January 5, 2022).
| 3 |
Unlike 4G LTE, which operates on established frequency bands below 6GHz, 5G requires frequencies up to 300GHz. Wireless carriers still need to bid for the costly higher spectrum bands, as they build and roll out their respective 5G networks. Adding the hardware required for 5G networks can significantly increase operating expenses. Building 5G networks is expensive. According to Heavy Reading’s Mobile Operator 5G Capex, total global spending on 5G is set to reach $88 billion by 2023.12
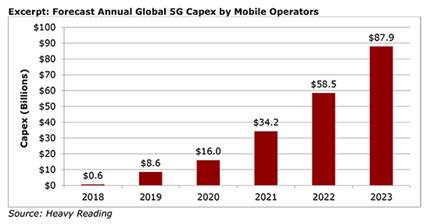
Figure 2. Mobile Operator 5G Capex Forecasts: 2018-2023.
A typical 5G base station consumes up to twice or more the power of a 4G base station. Energy costs can grow even more at higher frequencies due to a need for more antennas and a denser layer of small cells. Edge computing facilities needed to support local processing and new internet of things (IoT) services will also add to overall network power usage.
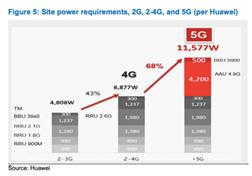
Figure 3. Site Power requirements 2G, 2-4G, and 5G.
Select 5G base stations in China are being powered off every day from 21:00 to 9:00 to reduce energy consumption and lower electricity bills. 5G base stations are substantial energy consumers such that electricity bills have become one of the highest costs for 5G network operators.
____________
12 Heavy Reading, Report, “Mobile Operator 5G Capex Forecasts: 2018-2023” available at: http://www.heavyreading.com/details.asp?sku_id=3568&skuitem_itemid=1789 (last accessed on January 5, 2022).
| 4 |
Our ultra-narrowband wireless communication 5G+ technology aims to achieve both low band 5G coverage and 1 Gbps high-band speed because we employ an ultra-narrow spectrum channel (<1KHz) to establish an ultra-long-distance link between the 5G base station and the receiver. The ultra-narrowband modulation was initially conceived in 1985 by Dr. Harold R. Walker as a method to be used with ‘frequency modulation (FM) Sub-Carriers’ (as opposed to “FM Supplementary Carriers” or “In Band On Channel” Carriers). In its original form, data rates as high as 196 kb/s were obtained from a subcarrier at 98 kHz, and bandwidth spectral efficiencies as high as 15 bits/sec/Hz were achieved. A pulse width modulation baseband encoding method called the “Slip Code” was used. That method, which was a baseband method, was limited in data rate and required excessive filtering, which precluded it from being a practical ultra-narrowband method.
Ultra-narrowband (“UNB”) technology employs an ultra-narrow spectrum channel (<1KHz) to establish an ultra-long-distance link between transmitter and receiver. UNB allows for long-range coverage, making it an optimal low-power wide-area network technique for industrial IoT systems. Additionally, its ultra-high power spectral density creates endurance against interference and jamming, which enables the friendly coexistence of UNB on shared frequency bands. The narrower the bandwidth, the fewer occurrences of noise and interference entering the bandwidth. In addition, UNB’s transmission of energy concentrates on ultra-narrowband width, resulting in a very high concentration of power in a very narrow frequency band.
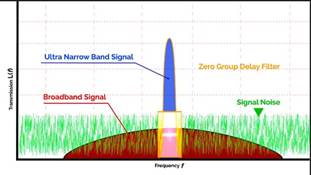
Figure 4. Comparison between Ultra-narrowband and Broadband
Many traditional modulation approaches require allowance for upper and lower sidebands throughout the carrier frequency. UNB modulation is a modified approach for data transmission without sidebands. UNB is extremely robust in an environment with other signals, including spread spectrum signals. However, spread spectrum networks are affected by UNB signals.
UNB modulation utilizes a coded baseband with abrupt edges. Any bandpass filter used at the transmitter for ultra-narrowband modulation must exhibit zero group delay to pass the instantaneous phase changes. However, it may lack the bandwidth required to pass instantaneous changes in frequency. Conventional filters cannot be used with ultra-narrowband signals, which are absolutely dependent upon negative or zero group delay filters.
One important characteristic has restricted widespread adoption of ultra-narrowband modulation, and that is the zero group delay filters, which are complex and must be hand-tuned. Furthermore, zero group delay filters are responsible for restricting data rates to just 196 kb/s from a subcarrier at 98 kHz and bandwidth spectral efficiency to 15 bits/sec/Hz.
| 5 |
We developed an ultra-narrowband technology that offers a potential alternative and/or complementary solution to the broadband technology used in 5G networks and meets the challenging 5G demands. A comparison of our ultra-narrowband technology with 4G and 5G is illustrated in the table below:
| Technology | Bandwidth | No. of subcarriers | Operating Frequency | Speed | Spectral |
| MHz | GHz | Mbps | Bits/s/Hz | ||
| 4G | 20 | 1200 | 6 | 4-60 | 6 |
| 5G | 100 | 3276 | Up to 300 | 40-1100 | 10 |
| UNB (finished) | 0.001 | 1 | 0.004 | 4 | ~4000 |
| UNB (in development) | 0.001 | 1 | 0.064 | 64-256 | >4000 |
As shown in the table, our internal testing shows that our finished ultra-narrowband technology can achieve speeds of 4 Mbps per second at a bandwidth of less than 1000 Hz. The spectral efficiency of our finished technology has reached 4000 bits/sec/Hz. Development work of our ultra-narrowband technology is underway for speeds of 64 Mbps at a bandwidth of 64 MHz with spectral efficiency of over 4000 bits/sec/Hz.
UNB speeds will increase proportionally if it operates at the higher frequencies used by 4G or 5G networks or adopts multiple subcarriers, equivalent to increasing bandwidth. As a result, we believe that our ultra-narrowband technology can reach 5G speeds and has the potential for much higher speeds. Utilizing the same bandwidth, our internal results show that UNB can save energy of up to 20,000 times when compared to current 4G technology and 100,000 times when compared to current 5G technology. Keeping the same bandwidth and energy consumption, our internal testing results suggest the coverage provided by UNB can increase by two orders of magnitude. UNB breaks through the Shannon Law’s critical limit that current 5G cellular communication is reaching, overcomes the current 5G challenges, and allows cellular communication development beyond 5G.
Despite the excitement surrounding 5G networks, several challenges need to be address before global adoption of 5G technology can occur.
| 1) | Spectrum availability. |
5G networks operate on higher bandwidth frequencies reaching up to 300 GHz, which permit data rates capable of delivering ultra-fast speeds measuring as much as 20 times more than those provided by 4G LTE networks. However, the availability and cost of spectrum bands are still an issue for wireless operators. Wireless operators need to bid for these costly higher spectrum bands as they build and deploy their respective 5G networks. On February 24, 2021, the Federal Communications Commission announced the winning bids in Auction 107, the auction of 3.7 GHz service licenses. The winning bids for all 5,684 available licenses totaled over $81 billion and were concentrated among just 21 bidders.13 Given that Focus Universal operates in the ultra-narrowband spectrum where very limited spectrum is required and public access spectrum is also available, this is potentially less of a concern than pursuing the traditional broadband capacity pathways.
___________
13 Federal Communications Commission. (2021, February 24). FCC Announces Winning Bidders in C-Band Auction [Press release]. https://www.fcc.gov/document/fcc-announces-winning-bidders-c-band-auction.
| 6 |
| 2) | Coverage. |
Despite 5G networks offering significantly increased speeds, their more limited range will require increased infrastructure investments. 5G requires three to four times the number of base stations to provide the same coverage area as 4G LTE because higher frequencies are more readily absorbed by solid objects than lower frequencies. For example, a signal at 700 MHz provides a coverage area three to four times that of a 2.6 GHz signal. Likewise, we expect UNB coverage to potentially increase coverage over standard 5G broadband pathways.
| 3) | Cost. |
Building a 5G network is expensive. To do so is not just building a layer on top of an existing 4G network; instead, it is laying the groundwork for something new altogether. The cost of a current 5G base station is approximately three times that of a 4G base station.14
| 4) | Energy consumption. |
Two factors relate directly to the increased energy consumption of 5G networks. First, 5G’s operating on higher frequency spectrums require greater energy input. For example, a typical 5G base station consumes up to twice the power consumed by a 4G base station. Second, to provide the same coverage area as a 4G network, a 5G network requires three to four times the number of base stations. Accordingly, the overall energy consumption of a typical 5G network will be at least six to eight times more than the energy consumption of a 4G network with equivalent coverage. Similar to the coverage applications, we also expect energy consumption to be potentially significantly less with UNB technologies over the conventional broadband pathways.
5G+
We are currently developing 5G+, which we believe is a promising alternative wireless technology that uses our innovative ultra-narrowband (UNB) wireless technology. UNB technology employs an ultra-narrow spectrum channel (<1 kHz) to establish an ultra-long-distance link between transmitter and receiver. Our internal testing suggests that a single 5G+ subcarrier wave has the potential to provide speeds of 64 to 256 Mbps. Moreover, multiple UNB subcarriers may be combined, which effectively increases bandwidth. Given anticipated data rates of 64 Mbps, we believe only 4 to 16 5G+ subcarrier waves would be needed to achieve the current 5G speeds, and just 40 to 160 5G+ subcarrier waves would be needed to achieve 6G speeds. By contrast, 5G technology requires 3,276 subcarrier waves to achieve its current speeds. Fewer subcarriers translate into cost savings because they are more compact and consume less energy. Our goal is to increase the speed of 5G networks while simultaneously reducing the number of subcarriers.
Our internal testing suggests that to achieve speeds of 1 Gbps, our 5G+ technology would only require bandwidths of 4 to 16 kHz, which is narrow enough to be operated in lower frequency spectrums. This would mean that 5G+ providers would not need to purchase the higher frequency spectrums required by 5G technology. Accordingly, a 5G+ provider would realize significant savings from not having to bid for costly higher spectrum band licenses. Operating in relatively lower frequency spectrum bands, when compared to 5G, also means that 5G+ would have a more extensive coverage area than that of 5G, in many cases three to ten times larger. It would also mean that we could reduce the number of subcarriers and reduce the overall costs of the 5G networks infrastructure.
Further, the design of 5G+ infrastructure means that cost savings could be realized as there is the potential of piggybacking the required 5G+ infrastructure on the current 4G infrastructure. Finally, 5G+ only consumes 1/25,000 to 1/6,250 of the energy consumed by 5G. As outlined above, 5G+ has the potential to overcome the challenges presented by the use of higher broadband spectrums required for the implementation of the broadband technology used in 5G.
_____________
14 “How much does it cost to build a 5G base station?” Phate Zhang, April 7, 2020, CNTechPost (available at: https://cntechpost.com/2020/04/07/how-much-does-it-cost-to-build-a-5g-base-station/ (last accessed on January 10, 2022)).
| 7 |
| 3. | Leveraging ultra-narrowband power line communication (“PLC”) technology. |
Our patented PLC is an innovative communication technology that enables sending data over existing power cables in the electric grid. Because PLC uses the existing power lines, it does not require substantial new investment for a dedicated wiring infrastructure. Existing power lines already form a distribution network that penetrates every residential, commercial, and industrial property. Given that the power grid is, for the most part, an established ubiquitous network, PLC is potentially the most cost-effective, scalable interconnectivity approach for the backbone communication infrastructure required for the IoT. PLC allows IoT devices to be plugged into power outlets to establish a connection using the existing electrical wiring, permitting data sharing without the substantial investment and inconvenience of running dedicated network cables.
Historically, the primary design goal of the power line network was electric power distribution. The power line network was not originally designed to function as a communication channel. Consequently, while PLC has been around for many years, the harsh electrical noise present on power lines and variations in equipment and standards make communications over the power grid difficult and present several challenges for data transfer. Signals propagating along the power line are subjected to substantial amounts of noise, attenuation, and distortion that make them erratic, with several attributes varying over time. PLC is susceptible to noise from devices linked to the power supply infrastructure, including, for example, fluorescent tube lights, drills, hair dryers, microwave ovens, computers, switch-mode power supply, cellphone chargers, dimmers, refrigerators, televisions, washing machines, and vacuum cleaners. The result is that previous attempts at implementing PLC technology resulted in power companies and internet service providers deciding that the technology is not a viable means of delivering data or broadband internet access. These technological challenges have impeded or even halted progress in PLC technology’s development.
We have successfully developed ultra-narrowband PLC technology that can transfer data through the power grid. According to our internal testing, our ultra-narrowband PLC technology can send and receive data without the customary interference that occurs in standard office and residential environments, achieving speeds of 4 Mbps at a bandwidth of less than 1000 Hz. To test noise interference and disturbance, we utilized six industrial blowers simultaneously when testing, and no significant interference was found. By comparison, a single hair dryer will render our competitors’ legacy PLC technology completely useless. We have completed the development of our 4Mbps PLC modules and the printed circuit board layout. These modules will be used for IoT systems involving over 1,000 sensors.
Our ultra-narrowband PLC technology is a considerably more effective way to transfer data than current in-home and commercial network systems, such as Zigbee and Z-Wave. While Zigbee and Z-Wave will need new infrastructure to be installed, our PLC technology could operate by itself or complement existing wideband communication tools like Wi-Fi, Zigbee, or Z-Wave. Penetrating physical barriers like walls within a single floor or reaching out to different floors in a single building is a challenge for the wireless technology that current IoT systems are using. Moreover, wireless networks often face performance issues due to radio-frequency interference caused by microwave ovens, cordless telephones, or even Bluetooth devices at home. However, our PLC technology can reach every node connected via the power lines. Our technology converts virtually every standard wall socket into an access point, in many ways incorporating the best of wired and wireless communication, making it a more consistent and reliable system for crucial and sensitive operations. Our ultra-narrowband PLC technology’s ability to reach long distances via power lines becomes especially useful in commercial networks that require the ability to avoid physical barriers like walls, underground structures, and hills, such as those networks used in industrial facilities, underground structures, golf course irrigation systems, and campuses. Moreover, our technology can be an integral part of any smart city, community, or campus.
| 4. | Developing a natural integrated programming language (“NIPL”) applied to software development, which generates a user interface through machine auto generation technology. |
We have developed a proprietary and patented “user interface machine auto generation platform” (“UIMAGP”) to replace the manual software designs that are currently used. This platform is used to build the IoT user interface. The natural integrated programming language we have developed is similar to the language humans use to communicate with each other, which makes it is easy for humans to learn, while still being understood by a machine. The UIMAGP simplifies the process of software programming by saving hundreds of lines of code into a micro code that can be saved to a sensor module. When that sensor module is plugged into a USIP, the user interface specification codes saved to the sensor module is sent to the platform and a universal display, such as a smartphone, a computer, or a display unit. The UIMAGP saved on the universal display automatically generates the user interface within milliseconds instead of requiring months or years of software development work. An embedded coding hardware engineer can design sensor module hardware and provide the user interface specification code. Thus, the hardware-defining software is achieved.
| 8 |
UIMAGP is similar to low code or no code programming because it reduces the amount of traditional hand-coding, enabling accelerated delivery of business applications. However, low code and no code programming suffer from integration restrictions, absence of customization, and security risks issues, making them unsuitable for large-scale and mission-critical enterprise applications such as IoT applications. UIMAGP has overcome these challenges while requiring only a minimum amount of coding. The UIMAGP and user interface specification codes work collectively to perform the function of traditional customized software, enabling UIMAGP to be shared by the estimated 20 billion IoT devices worldwide,15 a feat that current manual software designs could not achieve.
| 5. | Developing a universal smart instrumentation platform (“USIP”) |
Instrumentation is a vast industry that covers a variety of fields, including medical, healthcare, scientific, commercial, industrial, military, and daily life. Lack of instrumentation universality results in every instrument design starting from scratch. Moreover, each instrument can only carry out a determined measurement or control a specific operation. Integrating existing instruments that lack interoperability and compatibility into a platform can be difficult and expensive. This integration is impeded by the inability of instruments to easily communicate with devices and sensors for perception, mobility, and manipulation. As society enters the IoT era, it is not unreasonable to assume that millions of devices will need to be connected in one square kilometer. If each IoT device requires unique hardware and software developed from scratch, implementation in dense urban areas is simply not feasible. Wireless networks can be accessed by any device within the network’s signal range.
USIP is an advanced hardware and software integrated instrumentation platform with a large-scale modular design approach. USIP integrates a large number of technologies, including cloud technology, wired and wireless communication technology, software programming, instrumentation technology, artificial intelligence, PLC, sensor networking, and IoT technology into a single platform. This results in circuit designs that we believe are vastly cheaper and faster than those constructed of discrete integrated circuit components designed from scratch.
USIP has primary functionalities and an open architecture capable of incorporating a variety of individual instruments, functions, sensors, and probes from different industries and vendors into a single unit. Instruments, sensors, or probes ranging from a few to several hundred or even thousands in any combination from various industries and vendors can share or reuse the same platform. Adding, removing, or changing instruments or sensors is all the platform requires to switch from one type of device to another without revising the software and redesigning the hardware.
Compared to traditional stand-alone instruments, USIP exploits a computer’s or mobile devices’ processing power, productivity, display, and connectivity capabilities to provide a more powerful, flexible, and cost-effective measurement solution. Traditional hardware-centered instrumentation systems are made up of multiple stand-alone instruments interconnected to carry out a determined measurement or control an operation. They have fixed vendor-defined functionality, and the components that comprise the instruments are also fixed and permanently associated with each other. Different instruments provided by different vendors cannot be interoperated and interchanged. For example, we simply cannot use a traditional blood pressure meter to measure temperature or vice versa. USIP is designated to be compatible with all instruments, sensors, or probes on the market and capable of monitoring and controlling any combination of instruments or sensors. We believe our USIP will revolutionize the field of instrumentation, measurement, control, and automation.
USIP is a versatile platform, able to perform and combine different measurements and controls, to substitute some instruments for others, and to integrate existing instruments into it. The development of USIP is closely associated with the development and proliferation of computers and mobile devices that provide the foundation and technical support to the universal smart instrument such as an attractive graphical user touch screen interface, data processing and analysis capabilities, video and audio, cameras, GPS, ubiquitous wireless connectivity, artificial intelligence, cloud-based communications and a diverse number of functions and software available to users that are not contained in traditional instruments. These features embody the advantages of USIP, which are lacking stand-alone instrument systems. When compared with traditional instrument systems, USIP’s biggest advantage is cost savings. Other distinctive features include universality, interoperability, flexibility, compatibility, upgradeability, expandability, scalability, security, modularity, fast prototyping, reducing inventory, plug-and-play operation, remote accessibility, simplification, standardization, and cloud instrumentation.
________________
15 Gartner Insights “Leading the IoT,” available at: https://www.gartner.com/imagesrv/books/iot/iotEbook_digital.pdf (last accessed January 10, 2022).
| 9 |
We have been dedicated to solving instrumentation interoperability for over a decade. We subdivide instruments into a reusable foundation component to the maximum extent possible, architecture-specific components, and sensor modules, which perform traditional instruments’ functions at a fraction of their cost. For most instruments, 90% of the design, parts, and firmware are the same. These parts can be replaced by USIP.
USIP utilizes a computer or a mobile device as its display and control to communicate with a group of sensors, instruments, probes, or controllers manufactured by different vendors in a manner that requires the user to have little or no knowledge of their unique characteristics.
The portable version of USIP is illustrated below. When a blood pressure sensor is plugged into the universal device, the user interface specification code saved on the blood pressure sensor is sent to the universal device, and a computer or smartphone will then generate the user interface for the blood pressure device based on the interface specification code saved in the sensor.

Figure 5. A blood pressure sensor is connected to our universal device, which we call the Ubiquitor, and changes our device into a blood pressure measurement instrument.
Similarly, if we remove the blood pressure sensor and connect our universal device to both a pH sensor and a CO2 sensor, the universal device changes to a two-sensor device capable of measuring pH and CO2 concentration. Each sensor has its own user interface automatically generated based on the user interface specification code saved in each sensor.

Figure 6. A pH sensor and a CO2 sensor are connected to our universal device, and our device changes into a two-sensor device. A computer or smartphone can also be used for display.
As illustrated below, when a light sensor is also plugged into our universal device using a three-way splitter, the universal device becomes a three-sensor device.

Figure 7. A pH sensor, a CO2 sensor, and a light sensor are connected to the universal device, and the device changes into a three-sensor device. A computer or smartphone can also be used for display.
| 10 |
As illustrated in Figure 8, the universal device can connect any number of sensors in any combination.
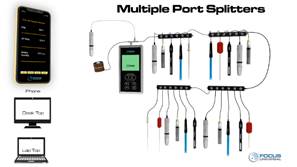
Figure 8. Any number of sensors in any combination can be connected to the universal device and changed it into a multiple sensor device. A computer or smartphone can also be used for the display.
As an example of the capabilities of the Ubiquitor, we implemented our universal device in the configuration pictured in Figure 9. This configuration demonstrates that our universal device simultaneously controls 27 light sensors, 21 pH sensors, and 23 temperature humidity sensors (which have 23 temperature sensors and 23 humidity sensors), representing one device controlling a total of 72 devices and 95 sensors. Our universal device also controls two lights in this configuration, which it can control by turning the lights on or off (including on a schedule) or by using a light sensor to control the lights’ output intensity.
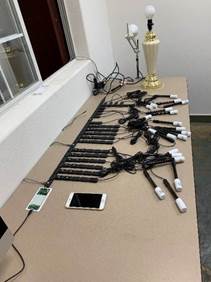
Figure 9. Our universal platform simultaneously monitors and controls 72 different devices and 95 sensors.
To illustrate, the entire horticulture industry has only a few hundred devices from different vendors for various measurement and control purposes. One of our universal smart devices and corresponding sensors or actuators can replace all at a fraction of the cost. Leveraging the same technical principles discussed above, we can simplify the smart control and monitoring in this and related industries (including agriculture and aquaculture) with a platform that requires little design work for interoperability between sensors and control devices.

Figure 10. Traditional horticulture measurement and control devices.
| 11 |
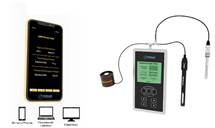
Figure 11. Universal Smart Device.
All household measurement and control devices, such as air conditioner controls, swimming pool controls, garage door controls, sprinkler controls, lighting controls, and motorized curtain controls, can be replaced by a single universal device and corresponding unique accessories.

Figure 12. A single universal smart device can replace all these household control devices.
| Internet of Things Overview |
IoT refers to the overarching network created by billions of internet-compatible devices and machines that share data and information worldwide. According to a Gartner report, by the end of 2020, there were an estimated 20 billion IoT-connected devices in use around the world.16 As the sophistication of both hardware and software in the consumer electronics industry skyrockets, an increasing share of the electronic devices produced around the world are manufactured with internet connectivity. Forecasts suggest that by 2030, around 50 billion of these IoT devices will be in use worldwide, creating a massive web of interconnected devices spanning everything from smartphones to kitchen appliances.17 The IoT will significantly impact the economy by transforming many enterprises into digital businesses, facilitating new business models, improving efficiency, and increasing employee and customer engagement. It is foreseeable that the explosive growth in IoT will rapidly deplete natural and human labor resources. We believe that IoT will soon reach a critical limit; we do not have enough human labor and natural resources to support IoT growth. Twenty billion IoT devices challenge existing resources. We have overcome the current massive IoT production challenges by developing a shared distributed universal IoT. Billions of internet-compatible devices and machines share data and information around the world and share a large section of hardware and software (up to 90%).
Billions of IoT devices are in use worldwide, each with different terminologies, technical specifications, and functional capabilities. These differences make it challenging to create one standard interoperability format for acquiring, harmonizing, storing, accessing, analyzing, and sharing data in near real-time. In fact, not even those instruments built on the same platform are necessarily interoperable because they are often highly customized to an organization’s unique workflow and preferences.
_____________
16 Gartner Report “Leading the IoT: Gartner Insights on How To Lead in a Connected World” available at: https://www.gartner.com/imagesrv/books/iot/iotEbook_digital.pdf (last accessed February 10, 2021).
17 Statista Report “Number of internet of things (IoT) connected devices worldwide in 2018, 2025 and 2030” available at https://www.statista.com/statistics/802690/worldwide-connected-devices-by-access-technology/ (last accessed January 10, 2022).
| 12 |
Wireless networks are far from perfect for IoT. They are typically slower, expensive, and highly susceptible to radio signals and radiation interference. They can be accessed by any device within range of the network’s signal, so unauthorized users may intercept information transmitted through the network (including encrypted data). Walls and floors can seriously limit the range of the wireless network. Our proprietary ultra-narrowband PLC technology offers a promising alternative to wireless networks. Integrating USIP with our ultra-narrowband PLC technology results in significant simplification and cost savings in implementing IoT, as illustrated in Figure 13. Using these technologies, we have designed IoT products for both residential and industrial usage and are now in the process of testing.

Figure 13. Comparison between (a) a traditional machine to machine IoT and (b) a shared distributed universal IoT, which depicts a USIP and sensors forming a local network through PLC technology. The platform communicates with the cloud to form a remote cloud-based system.
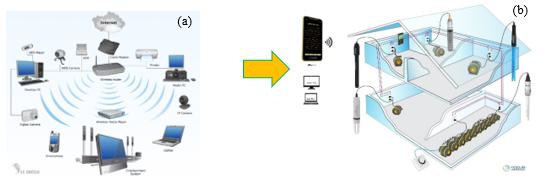
Figure 14. Comparison between (a) a traditional wireless network and (b) Focus Universal Inc.’s PLC network.
How we will implement our business plan
We currently operate in the scientific instruments industry and the smart home installations industry and plan to apply several of our new technologies to the IoT marketplace.
Four divisions have been established within our Company to develop and promote our technologies. We believe that our technologies, as depicted above, can be used in standalone device design and production and on large scale IoT device design and production, aiming to solve the attendant complexity and cost challenges.
| 13 |
a) Ultra-narrowband power line communication division.
Our ultra-narrowband PLC technology has achieved data transfer speeds of 4 megabits per second (“Mbps”), with a bandwidth of less than 1000 hertz (Hz). These results are 15 times faster than the Zigbee short-range wireless technology mesh networks and 100-400 times faster than Z-Wave’s low-energy wave short-range wireless technology. The current 4Mbps PLC modules will be used for IoT applications involving thousands of sensors. We are developing even higher communication speeds through our PLC. The ultra-narrowband PLC module will be integrated into ICs. This division will focus on ultra-narrowband PLC research and development, promoting and marketing ultra-narrowband PLC, ICs and finished products. We also intend to promote and market ICs, licensing, and contract designing.
Given that the power grid is an already established, ubiquitous network, connectivity via PLC technology may be the most cost-effective and scalable interconnectivity approach for the IoT. Due to the harsh electrical noise and interference currently present on power lines and to the variations in equipment and standards, that make data transfer using PLC technology limited and difficult, the global market for PLC technology is very limited.
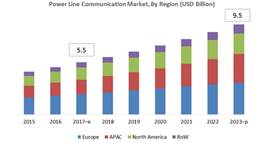
Figure 15. Markets and Markets Updated date – Oct 25
The market size for PLC is expected to reach $9.5 billion at the end of 2023.18 This prediction is based on current PLC technology, which provides speeds that are too slow (usually less than 9,600 bps), coverage that is too short (200-300 yards), and harsh electrical noise and interference. The major vendors of PLC technology include ABB, General Electric, Siemens, AMETEK, Schneider Electric, Texas Instruments, Maxim Integrated, Devolo, Cypress Semiconductor, ST Microelectronics, Panasonic, Microchip, Qualcomm Atheros, TP-Link Technologies, NETGEAR, D-Link, NXP Semiconductor NV, Landis+Gyr, Sigma Designs, Zyxel Communications, Nyx Hemera Technologies and Renesas Electronics Corporation.
It is our understanding that no other vendor has developed a PLC technology application that is similar to our ultra-narrowband PLC technology. We believe that market size will increase significantly with the introduction of our ultra-narrowband PLC technology, which can overcome the interference and noise challenges presented by traditional PLC technology. We believe that by utilizing ultra-narrowband PLC, the global IoT communication infrastructure costs and operating costs can be reduced.
b) Ultra-narrowband wireless division
This division will focus on developing ultra-narrowband wireless technology and overcoming the challenges facing current 5G networks. We intend to sell DoC for wireless communication, licensing, and contract designing.
While developing our ultra-narrowband PLC technology, we gained insight into the development of a single carrier wave ultra-narrowband wireless technology, which aims to increase data transfer rates from 4 Mbps to 64 Mbps. We expect our ultra-narrowband wireless technology to achieve data transfer rates of 256 Mbps using 4 subcarrier waves, which is close to 5G speeds requiring more than three thousand subcarrier waves. The projected speed can be further increased if multiple carrier waves or higher operating frequencies are used.
____________
18 Market Research Report “Powerline Communication Market by Offering (Hardware, Software, and Services), Frequency (Narrowband, and Broadband), Application (Energy Management and Smart Grid, and Indoor Networking), Vertical, and Geography – Global Forecast to 2023,” available at: https://www.marketsandmarkets.com/Market-Reports/power-line-communication-plc-market-912.html (last accessed February 10, 2021).
| 14 |
Our current research and development efforts are focused on an operating frequency of 64 megahertz (MHz), which is about 100 times lower than 4G networks (6 gigahertz (GHz)) and 5,000 times lower than 5G networks (up to 300 GHz). Our technology’s 1,000 Hz bandwidth is approximately 20,000 times narrower than 4G networks and 100,000 times narrower than 5G networks. The narrower the bandwidth, the less energy consumption. By maintaining the 1,000 Hz bandwidth, our ultra-narrowband wireless technology can save electricity usage by a factor of up to 100,000 times when compared with a 5G network. We believe that our ultra-narrowband wireless technology has the potential to push the wireless frontier well beyond 5G. We expect to finalize our ultra-narrowband technology research with data transfer speeds of 64-256 Mbps by the fourth quarter of 2022.
MarketsandMarkets projects that the 5G infrastructure market will reach USD 47,775 million by 2027, at a CAGR of 67.1%. The major players in the 5G infrastructure market are Huawei (China), Ericsson (Sweden), Samsung (South Korea), Nokia Networks (Finland), ZTE (China), NEC (Japan), CISCO (US), CommScope (US), Comba Telecom Systems (Hong Kong), Alpha Networks (Taiwan), Siklu Communication (Israel), and Mavenir (US). Huawei (China) is the leader in the 5G infrastructure market. Limited coverage, high energy consumption, and expensive infrastructure installation are the major holdups for the successful deployment of 5G technology. Most 5G technologies are based on broadband technology; our research suggests there are very few companies working on ultra-narrowband technology. We believe that adopting our ultra-narrowband wireless technology can provide significant cost savings to 5G spectrum bands, 5G network hardware, and 5G energy consumption.
c) User interface machine auto generation division
Established in 2009, our Company’s software user interface machine auto generation technology division has developed 100 sensors in arbitrary combinations, all of which have been tested for the iOS system. RS-485 is an industrial specification that defines the electrical interface and physical layer for point-to-point communication of electrical devices. RS-485 is widely adopted and used in the IoT industry. Standard RS-485 modules available today usually do not support more than 100 sensors. The first version of UIMAGP has been completed and we believe should support more than 1,000 sensors. We intend to sell and license the software to device manufacturers that use our DoC ICs and other industries where the software can be applied.
UIMAGP can be used in IoT software design and can be applied to other industry sectors. This division is planning to expand to other industries as well.
The software market size is enormous. According to www.grandviewresearch.com, the market reached $388.98 billion in 2020.
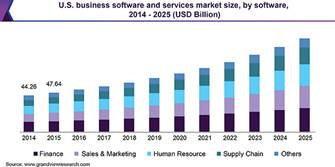
Figure 16. Software market size.
Today, some of the biggest companies within the software industry, including Microsoft, IBM, Oracle, SAP, and Salesforce, generate billions of dollars in annual revenue. None of these companies have developed a UIMAGP. Any software that can be created by low code and no code programming can also be created by using UIMAGP. However, the software created by UIMAGP achieves what low code and no code programming cannot because of the complexities of applying the code to different platforms and the accompanying required customization. One of the distinct features of UIMAGP is that the programming provides a starting point that includes foundational code that may be used on any platform or operating system. This makes the final programming much more efficient, as it needs relatively few lines of code to program a complicated application.
| 15 |
d) Universal smart instrument division
This division will focus on developing and marketing end-user universal smart instruments and shared distributed universal IoT devices for the commercial and residential markets. The development of universal smart instruments and IoT have considerable overlap, with the only difference being the number of devices involved. We will capitalize on this overlap by unifying universal smart instruments and IoT into a single system, eliminating any distinction between them. USIP, a cost-effective and fully production-ready hardware and software platform, provides a considerable advantage in shorting design, building, testing, and fixing cycles. Smart home products, including light controls, air conditioner controls, sprinkler controls, garden light controls, heating floor controls, motorized curtain controls, pool filtration and algae controls, smoke detector controls, carbon monoxide measurement, motion detectors, and doorbells, have been designed and tested.
This division will also develop and market end-user universal smart instruments and shared distributed universal IoT devices in the horticulture, agriculture, and aquaculture industries. Leveraging the Company’s ultra-narrowband PLC technology and USIP, we intend to provide a more stable, secure, and faster network for large industrial operations requiring data-specific sensing and control automation to ensure optimal outcomes. According to MarketsandMarkets, the agriculture IoT market is expected to grow from $12.7 billion in 2019 to $20.9 billion by 2024, at a CAGR of 10.4%.19 A key factor driving the growth of this market is the rising demand for agricultural production due to increasing population and adoption of IoT and AI technologies by farmers and growers. Deere & Company (US), Trimble (US), Raven Industries (US), AGCO Corporation (AGCO) (US), AgJunction Inc. (AgJunction) (US), DeLaval (Sweden), GEA Farm Technology (Germany), Lely (Netherlands), Antelliq (France), AG Leader Technology (AG Leader) (US), Tigercat (Canada), Ponsse (Finland), Komatsu Forest AB (Sweden), Caterpillar (US), Treemetrics (Ireland), Topcon Positioning Systems (US), and DICKEY-john Corporation (US) are some of the major players in the agriculture IoT market. We have completed the design of certain PLC industrial IoT devices, including industrial light controls, temperature controls, humidity controls, carbon dioxide controls, digital lighting controls, quantum PAR measurement and controls, pH measurement and controls, TDS measurement and controls, and fan speed controls.
The market size of the instrumentation industry is vast and difficult to estimate. However, the IoT industry sector is only a fraction of the larger market. MarketsandMarkets forecasts that the global IoT market size is expected to reach $561 billion by 2022.20 The key market players include Intel Corporation (US), SAP SE (Walldorf, Germany), Cisco Systems, Inc. (US), Microsoft Corporation (US), Oracle Corporation (US), International Business Machine (IBM) Corporation (US), PTC Inc. (US), Google Inc. (US), Hewlett-Packard Enterprise (US), Amazon Web Services Inc. (US), Bosch Software Innovation GmbH (Stuttgart, Germany) and General Electric (US). These industry players’ IoT devices are of a traditional machine-to-machine type and face challenges in terms of cost and implementation. Our shared distributed universal IoT devices are much more cost-efficient.
This division will also focus on developing device-on-a-chip (DoC) ICs, which we intend to sell to electronic device manufacturers for use in conjunction with the USIP. We will distinguish our DoC technology from the component ICs; these ICs can perform entire device functions. According to the “Integrated Circuits Global Market Report 2020,” the globally integrated circuits market was worth $412.3 billion in 2019.21 The market is expected to grow at a CAGR of 5.09% and reach a value of $502.94 billion by 2023. Major players in the IC market are Intel Corporation, Texas Instruments, Analog Devices, STMicroelectronics, NXP, ON Semiconductor, Micron, Toshiba, Broadcom, and Qualcomm.
_____________
19 MarketsandMarkets Market research Report, October 2019: “Agriculture IoT Market by Offering (Hardware, Software, & Services), Application (Precision Farming, Precision Forestry, Livestock Monitoring, Fish Farm Monitoring and Smart Greenhouse), Application, and Geography - Global Forecast to 2024,” available at: https://www.marketsandmarkets.com/Market-Reports/iot-in-agriculture-market-199564903.html (last accessed March 4, 2021).
20 Id.
21 The Business Research Company, March 2020, “Integrated Circuits Global Market Report 2020,” available at: https://www.thebusinessresearchcompany.com/report/integrated-circuits-global-market-report (last accessed January 24, 2021).
| 16 |
This division will also install and design customer solutions for residential and commercial IoT projects. The Company currently specializes in high-performance, easy-to-use audio/video, home theater, lighting control, automation, and home integration solutions for residential installation and custom solution services. On the commercial side, we plan to add well-trained staff ready to handle all aspects of voice, data, fiber, paging, audio-video services, CATV, and other low voltage premise cabling. All of our service providers hold certifications for multiple product lines and specialty work. The Company plans to use its current client base and expertise from these installation services to integrate products developed on the USIP into the project proposals.
Products we are currently selling
In addition to the technologies which we have developed and described above, we are a wholesaler of various digital, analog, and quantum light meters and filtration products, including fan speed adjusters, carbon filters, and HEPA filtration systems. We source these products from manufacturers in China and then sell them to a major U.S. distributor, Hydrofarm, who resells our products directly to consumers through retail distribution channels and, in some cases, places its branding on our products.
Specifically, we sell the following products:
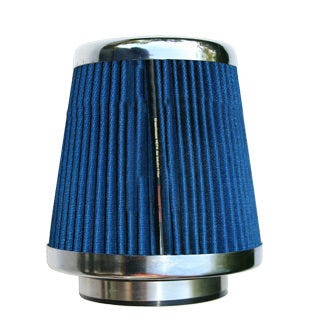
Fan speed adjuster device. We provide a fan speed adjuster device to our client Hydrofarm. Designed specifically for centrifugal fans with brushless motors, our adjuster device helps ensure longer life by preventing damage to fan motors by adjusting the speed of centrifugal fans without causing the motor to hum. These devices are rated for 350 watts max, have 120VAC voltage capacity, and feature an internal, electronic auto-resetting circuit breaker.
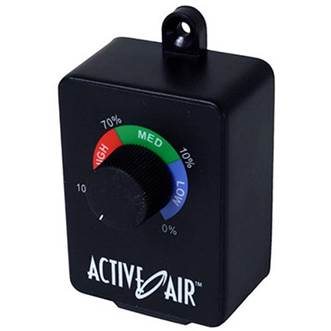
Our Fan Speed Adjuster Device
| 17 |
Carbon filter devices. We sell two types of carbon filter devices to our client Hydrofarm. These carbon filter devices are professional-grade filters specifically designed and used to filter the air in greenhouses that might be polluted by fermenting organics. One of these filters can be attached to a centrifugal fan to scrub the air in a constant circle or can be attached to an exhaust line as a single pass filter, which moves air out of the growing area, filters unwanted odors, and removes pollen, dust, and other debris in the air. The other filter is designed to be used with fans from 0-6000 C.F.M.
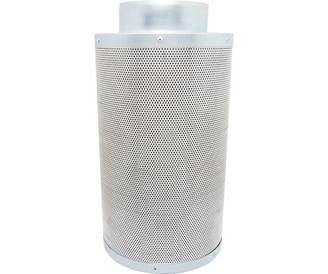
Our Carbon Filter Device
HEPA filtration device. We provide a high-efficiency particulate arrestance (“HEPA”) filtration device at wholesale prices to our client Hydrofarm. Manufactured, tested, certified, and labeled in accordance with current HEPA filter standards, this device is targeted towards greenhouses and grow rooms and designed to keep insects, bacteria, and mold out of grow rooms. We sell these devices in various sizes.
Our HEPA Filtration Device
| 18 |
Digital light meter. We provide a handheld digital light meter to measure luminance in FC units or foot-candles.
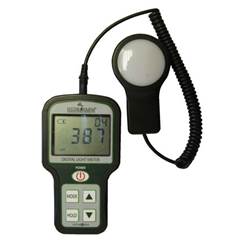
Our Digital Light Meter Device
Quantum par meter. We provide a handheld quantum PAR meter to measure photosynthetically active radiation (“PAR”). This fully portable handheld PAR meter measures PAR flux in wavelengths ranging from 400 to 700 nm. It is designed to measure up to 10,000 µmol.
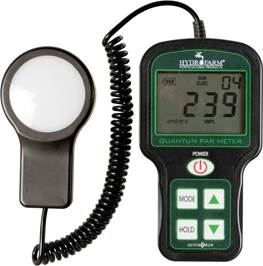
Our Quantum Par Meter Device
| 19 |
Strategy behind AVX Acquisition
On March 15, 2019, the Company completed a transaction with Patrick Calderone to purchase 100% of the outstanding stock of AVX Design and Integration, Inc. (“AVX”), an IoT installation and management company based in southern California.
Through our acquisition of AVX, we are planning to offer residential customers an entire smart home product line in the $3,000 range We have finished designing smart devices for lighting control, air conditioner control, sprinkler control, garden light control, garage door control, and heating control. We are developing a swimming pool control device, smoke detector, and carbon monoxide monitor.
We believe smart home installation based on the USIP, and our Ubiquitor will include more functionalities than the current systems offered by our competitors. Our smart home systems would integrate, exchange data, interact and connect utilizing our PLC technology. As a result, the installation process would be simplified, and its costs would be reduced.
Once successfully integrated, the Ubiquitor will be central to every smart home installation that AVX does. The Ubiquitor’s connectivity capabilities will allow that system to be expanded and customized in the future. We also plan to offer zero down payment options for installation of AVX’s smart home systems and charge a monthly subscription fee instead.
Notwithstanding the foregoing, should we be unable to successfully integrate the Ubiquitor into AVX’s smart home installations, the Ubiquitor will continue to be a flagship product of our Company that can be applied to various other purposes in the different industries and fields mentioned above.
Strategy and Marketing Plan
The Company plans to market the USIP to the industrial sector first, including key growth industries such as indoor agriculture. Once the technology is established there, the core technologies of universality and interoperability through a readily available device, such as a mobile device or smartphone, may be ported to products specifically intended for the consumer and residential markets.
While industrial markets are large, the consumer and residential markets are even more significant. This two-phase approach will allow for continuous and increasing revenue growth. Moreover, during the industrial phase of development, the Company will test and refine its products to ensure that they are ready for the consumer and residential markets.
Once we have successfully entered the industrial sector, we intend to roll out additional technologies that are currently under development. These technologies will advance and support the core technologies marketed in phases one and two to the industrial and consumer markets.
We will continue to design, manufacture, market, and distribute our electronic measurement devices, such as temperature humidity meters, digital meters, quantum PAR meters, pH meters, TDS meters, and CO2 monitors. Over the years, Hydrofarm has developed a broad and loyal customer base that buys our existing products on a repeat basis. The universal smart technology has been applied to our existing traditional devices and demonstrated significant functional improvement and hardware cost savings. We believe hardware cost reductions of up to 90% have been achieved. However, promoting universal smart technology and universal smart IoT devices to our customers, including traditional instrument manufacturers, will be the central focus of our business in the future.
Different markets require different strategies. We divided our customers into a few segments to determine what specific marketing technique will reach each targeted group and its needs.
a) Our Existing Customer, Hydrofarm
To minimize the upfront cost of entering a market, we must carefully choose our entry point to find one that offers the least possible resistance. It costs more to attract new customers than to retain and increase sales to our existing customer, Hydrofarm. Our universal smart instruments’ design, development, and manufacture are targeted to increase current sales to our existing customer.
| 20 |
Our current customer, Hydrofarm, is the largest distributor in the horticulture industry, with roughly 50% of the market share in the U.S. horticulture industry.
All our current universal smart devices, including sensors and controllers, will be distributed to Hydrofarm. Smartphones can be used to display and control all the sensors and controllers in the horticulture industry. By the end of 2020, we completed the development of several sensors that are used in the gardening industry, including a light control node, temperature sensor, humidity sensor, digital light sensor, quantum PAR sensor, pH sensor, TDS sensor and carbon dioxide sensor; and we finished the circuit layouts for the pilot IoT system for the gardening industry (consisting of approximately 1,000 sensor nodes and controllers). We sent these circuit layouts to our manufacturer in China for production. However, due to the coronavirus pandemic, the production was delayed. In 2022, we intend to extend our product line to Hydrofarm, who in turn will resell and market our systems and devices to its customers in the horticulture industry.
b) Online Customers
We intend to use traditional and specialized e-commerce outlets to help with online brand awareness. By analyzing Amazon’s data, we plan to determine which traditional instruments have the highest selling volumes and at what price point. Future research and development will focus on integrating the sensors used in these instruments into the universal smart instruments to leverage on their existing markets.
c) Traditional Controller and Remote-Control Customers
Traditional controllers monitor and control their sensors through bi-directional communication implemented by hardware. The sensors or probes in controllers not only measure the physical environment but also give feedback to the input actuators that can make necessary corrections. They are expensive and require a corresponding monitor in which unidirectional communication is needed. For example, a traditional temperature meter may cost approximately $15 and a temperature controller may cost approximately $100. The wireless bi-directional communication supported by a smartphone or mobile device offers cost reduction in controller design and manufacturing. Traditional remote control is accomplished through hardware, which can be replaced by a smartphone. Universal smart technology will also play an important role in traditional control applications. Traditional controller users are one of highest profit margin customers of universal smart technology.
d) Special Customers
For customers who consider an instrument’s compatibility, interoperability, interchangeability, universality, upgradeability, expandability, scalability, and remote access ability as crucial, universal smart technology has several fundamental advantages over traditional instruments in terms of hardware cost and functionality. End users will not only enjoy the remote access to their sensors wirelessly but also save the cost of the hardware module which will be replaced by a smartphone.
e) Traditional Instruments Manufacturers
We may consider selling the Ubiquitor directly to instrument manufacturers and allowing them to distribute it through their established platforms. We are putting together an internal sales team in order to establish the marketing campaign for our sensor devices, including the Ubiquitor. We are also expanding the sales team for AVX because we believe that the Ubiquitor device will be integral to smart home installations.
We believe that universal smart technology will play a critical role for traditional industrial instrument manufacturers, because it is too expensive and difficult to develop industrial instrument sensors for medium or smaller companies or individual homes. The cost factor is the first consideration when deciding whether a company wants to develop universal smart technologies and implement them in their products.
On December 23, 2021, Focus Universal (Shenzhen) Technology Co. LTD was founded as a mainland China office for manufacturing procurement expertise and support research and development activities. Focus Universal (Shenzhen) Technology Co. LTD is 100% owned by Focus Universal Inc. and designed to function as a branch office accessing high level ability to source products and build relationships with manufacturers in the region and as a lower cost form of support research and development as engineers are more plentiful in the region. In the future, this office could also handle other online marketing and marketing production activities, provided a cost and quality benefit exists at the time.
| 21 |
Our goals over the next three years include:
| · | Raise capital to move into full manufacturing and production for our Ubiquitor device; |
| · | Partner with manufacturers and promote the adoption of our Ubiquitor device in a USIP; |
| · | Acquire a stable market share of the sensor device market; |
| · | Continue performing research and development on PLC technology; |
| · | Focus on building our smart home offerings so that we can reduce the cost of smart home implementation to focus on expanding smart home installation and implementation beyond luxury homes; |
| · | File additional patents to expand our intellectual property portfolio related to the many uses of our Ubiquitor device; and |
| · | File patents to protect our PLC technology. |
In order to achieve these goals, we intend to focus on the following initiatives:
| · | Position the Ubiquitor device as the industry standard in universal sensor reading technology; |
| · | Establish strategic supply chain channels to facilitate efficient production operations; and |
| · | Communicate the product and service differentiation through direct networking and effective marketing. |
Growth Strategy
Growth through Mergers and Acquisitions
Mergers and acquisitions (“M&A”) represent a significant part of our growth strategy because M&A can fill business gaps or add key business operations without requiring us to wait years for marketing and sales cycles to materialize. We have used this growth strategy in our acquisition of AVX, and in the future intend to continue to use M&A to find and secure opportunities that will either: (i) achieve the objective of growth in our market segments; or (ii) provide an area of expansion that will add to the Company’s products and/or service lines in markets that we are currently not serving, but could serve if we had the appropriate expertise. The resulting combination of our existing products and services, new key personnel, and strategic partnerships through M&A will allow us to operate in new markets and provide new offerings to our existing market.
Acquiring key competitors may allow the addition of key personnel to our team. These additions may include people with vast industry knowledge, which can act as a catalyst to further our growth and lead to the development of new products and business lines. We will seek to target synergistic acquisitions in the same industry, targeting different geographic locations, which will allow us to actively compete on a regional or national scale in the IoT segment. If we target businesses in the same sector or location we hope to combine resources to reduce costs, eliminate duplicate facilities or departments and increase revenue. We believe this strategy will allow for accelerated growth and maximize investor returns.
One of our key strategies to grow through M&A is to acquire smaller businesses that focus on IoT installation technology (industrial or residential) and in the USIP or PLC industries.
| 22 |
Original Equipment Manufacturer (“OEM”) Engineering Consulting and Design Services
Universal smart technology is new to most electronic engineers and manufacturers. One way to promote our universal smart technology is to provide direct OEM engineering design consulting services to potential industrial customers. Direct, on-site consulting will educate our industrial consumers on the many ways our technology can be implemented in a variety of industrial applications. We believe that we are well positioned to perform product design and engineering consulting services for future OEM customers. We believe we can operate as a seamless extension of our customers’ engineering organizations and add scale, flexibility and speed to their design processes. We will not be able to offer such engineering consulting and design consulting services until the Ubiquitor is being produced and distributed. We believe that once the Ubiquitor is being produced and distributed, we will have hired and trained enough engineers to execute our consulting strategy. Through our engineering consulting services strategy, we intend to become our customers’ engineering partner at all stages of the design cycle so that we may effectively assist them in transforming ideas into production-ready products and accelerate time to market for our universal smart technology product segment.
Technology Licensing
We may also consider entering into licensing arrangements with our customers for our technology. We believe that once we educate our industrial consumers, they may want to integrate our universal smart technology into their own technology through licensing agreements. We believe licensing our intellectual property may provide a revenue stream with no additional overhead, all while allowing us to retain proprietary ownership and create long-term industrial consumers who rely on our products. By creating incentives, such as cost incentives, to license our IP rather than design their own technology, we believe potential customers could save on design costs and create business development opportunities. Licensing may also allow us to rely on the expertise, capacity and skill of a licensee to commercialize our IP, which is especially valuable if we lack the infrastructure, financial resources and know-how to bring a product to market independently. Although a licensing deal can occur at any time, we do believe that licensing may not occur until the last quarter of 2022 due to the fact that we will need to have a team of our consulting engineers in place, working with industrial consumers on product integration, as well as time to negotiate the terms of licensing agreements with potential customers.
Distribution Method
We intend to engage in relationships predominantly with standard U.S. component manufacturers and similar electronics providers for the manufacturing of unassembled parts of the Ubiquitor and its sensor nodes, and to then ship such parts to our Ontario, California facility where we will assemble the Ubiquitor devices and sensor nodes. Afterwards, we would distribute our Ubiquitor devices to distributors and retailers directly and also ship directly to traditional industrial instrument manufacturers. We have a sales department operating out of our Ontario, California office and eventually plan to open a second sales department in China dedicated to promoting our technologies to local instrument manufacturers who can utilize our Ubiquitor devices in their manufacturing and other processes. We intend to market the Ubiquitor to industrial end-users through Hydrofarm, through direct business-to-business sales channels and also directly to consumers via e-commerce internet platforms. For our quantum light meters, and air filtration products, we rely solely on Hydrofarm to distribute to end-users through its distribution channels.
Raw Materials
The electronic components used in the Ubiquitor are common and can be easily purchased through a variety of suppliers with little advanced notice. We predominantly use large-scale manufacturers in the United States such as Texas Instruments and Intel for the major components. Other key suppliers we could consider include Analog Devices, Skyworks Solutions, Infineon, STMicroelectronics, NXP Semiconductors, Maxim Integrated, On Semiconductor, and Microchip Technology. Production and assembly lines are also available worldwide if we needed to outsource or increase our capacity, though we intend to complete our assembly in our Ontario, California facility. On October 1, 2018, we entered into an agreement with Beijing Hengnar Technology Development Co., Ltd. to develop certain infrared online gas analyzer products that detect O2, CO, CO2, H2, Nox, SF6 and other gases for our digital light meter and filtration business segment.
| 23 |
Manufacturing and Assembly
We have an assembly facility in Ontario, California where we assemble the Ubiquitor from parts sourced predominantly in the United States. Our quantum light meters and handheld sensors are also manufactured in our Ontario, California facility. Our air filtration products are manufactured and assembled in China by a third-party contract manufacturer, Tianjin Guanglee.
Our subsidiary unit in the Canton province of mainland China, Focus Universal (Shenzhen) Technology Co. LTD, was founded in December 2021 as an office for manufacturing procurement expertise and support research and development activities. Focus Universal (Shenzhen) Technology Co. LTD is designed to function as a branch office accessing high level ability to source products and build relationships with manufacturers in the region and as a lower cost form of support research and development as engineers are more plentiful in the region. In the future, this office could also handle other online marketing and marketing production activities, provided a cost and quality benefit exists at the time. This excludes any projects subject to approval or that require a separate business license in accordance with the local laws. China allows foreign entities to setup wholly owned limited liability companies in China, also known as Wholly Foreign Owned Enterprises (WFOEs), in non “restricted” or “prohibited” industries or business activities. The subsidiary’s business operation has been approved by the local government in Shenzhen to be qualified as a WFOE entity in China. The entity is 100% owned by Focus Universal Inc.
Competitors
Sensor Node Industry
There are several competitors we have identified in the sensor node industry, including traditional instruments or devices manufacturers such as Hanna Instruments or Extech Instruments.
Hach developed and launched the SC1000 Multi-parameter Universal Controller, a probe module for connecting up to 32 digital sensors or analyzers. However, their products are not compatible with smart phones yet; and we believe their price point is still prohibitive to consumers.
Monnit Corporation offers a range of wireless and remote sensors. Many of Monnit’s products are web-based wireless sensors that usually are not portable because of their power consumption. Also, the sensors’ real-time updates are slow; and we believe security of the web-based sensor data acquisition may be a concern. In addition to purchasing the device, consumers usually have to pay a monthly fee for using web-based services.
IoT Installation Industry
There are several companies that compete with AVX in smart home installations, including Vivint Smart Home, Crestron and Control4. However, we believe we can distinguish ourselves from our competitors by offering a substantially lower price. An installation by Crestron ranges between $20,000 and $100,000 and by Control4 between $20,000 and $40,000. The cheapest competitor we can identify in this sector is Vivint Smart Home, which costs less than $5,000 to install; however, we understand that the Vivint Smart Home focuses on security systems only and that users have no other smart applications, which our smart home product line would include.
Air Filtration Systems and Meter Products Industry
The air filtration system and meter products industry is a niche industry. The global industrial air filtration market was valued at $11.6 billion in 2018 and analysts expect it to register a CAGR of 6.7% from 2019 to 2025 because of the industrial need to control air quality across a range of industries.22 Air purification methods are an effective way to control contaminants and improve indoor air quality and as a result, many national and local governments overseeing indoor air quality and other emissions are enacting stricter workforce health and safety regulations in this area, which drives demand. One of our competitors, Donaldson Company, Inc., an air filtration company, announced in its SEC filings that on October 18, 2018 it acquired BOFA International LTD (“BOFA”), headquartered in the United Kingdom, for $98.2 million less cash acquired of $2.2 million. BOFA manufactures systems across a wide range of air filtration applications.
We are not trying to compete with traditional instruments or device manufacturers because we plan to utilize our Ubiquitor device in conjunction with our smartphone application. We believe the resulting product may compete in a much wider product category due to its many potential applications.
___________
22 Grand View Research. (2020, February). Industrial Air Filtration Market Size, Share & Trends Analysis Report, by Product, by End Use (Cement, Food, Metals, Power, Pharmaceutical, Agriculture, Paper & Pulp and Woodworking, Plastic), by Region and Segment Forecasts, 2020-2027. Retrieved at: https://www.grandviewresearch.com/industry-analysis/industrial-air-filtration-market.
| 24 |
Our Corporate History
We are based in the City of Ontario, California, and were incorporated in Nevada in 2012. In December of 2013, we filed an S-1 registration statement that went effective on March 14, 2014. From March 14, 2014 through August 30, 2021, our securities traded on the OTCQB Market. From August 31, 2021, our securities traded on the Nasdaq Capital Market. From January 28, 2022, our securities traded on the Nasdaq Global Market.
Our website is www.focusuniversal.com. Our website and the information contained therein or connected thereto are not intended to be incorporated into this report.
The Company entered the residential and commercial automation installation service industry through the acquisition of AVX Design and Integration, Inc. (“AVX”) in March of 2019. AVX was established in 2000 with the goal of installing high-performance, easy-to-use Audio/Video, Home Theater, Lighting Control, Automation and Integration systems for high-net-worth residential projects.
Additionally, we are performing research and development on an electric power line communication (“PLC”) technology and have filed three patents with the United States Patent and Trademark Office (USPTO) related to our Ubiquitor device and the design of a quantum PAR photo sensor. Eventually, we hope that PLC technology will further enhance smart IoT installations performed by AVX and powered by the Ubiquitor.
On October 21, 2015, Dr. Jennifer Gu and Dr. Edward Lee were appointed as directors of the Company. After such appointments, the Board of Directors consisted of Dr. Desheng Wang, Dr. Jennifer Gu and Dr. Edward Lee.
On April 2, 2018, Duncan Lee was appointed as the Chief Financial Officer of the Company.
On June 8, 2018, we announced the appointment of four new board members of the Company, the majority of whom were independent: Sheri Lofgren, Sean Warren, Michael Pope, and Carine Clark. Our Board of Directors subsequently formed our Audit, Compensation, and Nominating Committees.
On July 26, 2018, our Board of Directors approved our submission of an application in compliance with The Nasdaq Stock Market LLC (“NASDAQ”) rules and regulations to list and trade our Company’s securities on the Nasdaq Capital Market.
On November 28, 2018, Sean Warren resigned as a member of the Board of Directors; and Greg Butterfield was appointed in his place. On December 1, 2018, Mr. Warren became a part-time consultant to the Company.
In late 2018, we purchased a manufacturing warehouse and office space addressed at 2311 East Locust Court, Ontario, CA, 91761. The property consists of an industrial type, two-story building, with a total building area of 30,740 square feet. Ten thousand square feet will be utilized for office space; and 20,000 square feet will be utilized for warehouse space. The property includes 58 parking spaces. The purchase price for the property was approximately $4.62 million.
On March 15, 2019, the Company entered into a stock purchase agreement with Patrick Calderone, the CEO and owner of AVX, whereby the Company purchased 100% of the outstanding stock of AVX (the “AVX Acquisition”) for $890,716. The purchase price was structured as follows: (1) $550,000 payable in cash at closing; (2) $290,716 payable in 39,286 shares of the Company’s common stock issued upon closing; and (3) $50,000 payable in the form of a secured promissory note at 6% interest over 12 months secured by six shares of AVX common stock. In connection with the AVX Acquisition, Patrick Calderone also entered into a consulting agreement with the Company pursuant to which he would offer consulting and training services during the 12-month period following the closing of the AVX Acquisition. Since AVX is an installer of smart home products, and since we anticipate that our Ubiquitor device is capable of enhancing smart home installations, we believe that this acquisition will allow us to test new applications and the integration capabilities of our Ubiquitor device in smart homes.
On November 15, 2019, Dr. Edward Lee resigned as President of the Company and was appointed to be the Chairman of the Board of Directors.
On August 31, 2021, the Company commenced trading on the Nasdaq Capital Market under the symbol “FCUV.”
| 25 |
On September 2, 2021, the Company announced the closing of an underwritten public offering of 2,300,000 newly issued shares of common stock at a price to the public of $5.00 per share. The closing included the full exercise of the underwriters’ over-allotment option to purchase 300,000 shares of common stock at the public offering price, for gross proceeds to the Company of $11.5 million, prior to deducting underwriting discounts and commissions and offering expenses payable by us.
On November 10, 2021, the Company appointed Irving Kau as Vice President of Finance and Head of Investor Relations.
On January 26, 2022, the Company announced approval for the uplist of its stock onto the Nasdaq Global Market exchange under the symbol “FCUV.”
Patent, Trademark, License and Franchise Restrictions and Contractual Obligations and Concessions
On November 4, 2016, we filed a U.S. patent application number 15/344,041 with the USPTO. On March 5, 2018, we issued a press release announcing that the USPTO had issued an Issue Notification for U.S. Patent Application No. 9924295 entitled “Universal Smart Device,” which covers a patent application regarding the Company’s Universal Smart Device. The patent was granted on March 20, 2018.
Subsequent to our internal research and development efforts, we filed with the USPTO on June 2, 2017, a patent application regarding a process for improving the spectral response curve of a photo sensor. The small and cost-effective multicolor sensor and its related software protected by the potential patent we believe could achieve a spectral response that approximates an ideal photo response to measure optical measurement. The patent was issued on February 26, 2019.
On November 29, 2019, the Company filed an international utility patent application filed through the patent cooperation treaty as application PCT/US2019/63880. In April 2020, the Company was notified that it received a favorable international search report from the International Searching Authority regarding this patent application, which patents the Company’s PLC technology. The World International Property Organization report cited only three category “A” documents, indicating that the Company’s application met both the novelty and non-obviousness patentability requirements. Consequently, the Company is optimistic that the patent covering the claims for its PLC technology will be issued in due course and will allow the Company to implement strong protections on the PLC technology worldwide.
On May 19, 2021, we filed thirteen provisional patent applications with the USPTO that we had been researching and developing for years encompassing a broad spectrum of technology areas including sensor technology, wired and wireless communications, power line communications, computer security, software solutions, interconnected technological communications, smart home systems and methods for both home and hydroponic areas, dynamic password cipher, local file security, payment card security, infrared sensor, and a method and apparatus for high data rate transmission.
In the fourth quarter of 2021, we hired the law firm of Knobbe Martens, Olson & Bear, LLP to serve as outside intellectual property counsel for the Company. The firm is working on transferring the Company’s provisional patent applications to formal patent applications.
Research and Development Activities
For the year ended December 31, 2021, we spent a total of $220,469 on research and development activities; and for the year ended December 31, 2020, we spent a total of $256,636.
Focus Universal (Shenzhen) Technology Co. LTD was founded as a mainland China office for not only manufacturing procurement expertise but also non-confidential support research and development activities. This wholly owned subsidiary is registered to be engaged in IoT research and development and IoT sales and service amongst other related activities.
Compliance with Environmental Laws
We are not aware of any environmental laws that have been enacted, nor are we aware of any such laws being contemplated for the future, that impact issues specific to our business.
| 26 |
Employees
As of the date of this report we have 13 full-time employees and 4 part-time employees. The Company’s Chief Executive Officer and Secretary is Dr. Desheng Wang, and our Chief Financial Officer is Duncan Lee. Irving Kau serves as Vice President of Finance and Head of Investor Relations. We have a head of marketing whose efforts are focused on the controlled agricultural market segment. We also have a CEO of our China subsidiary who leads the component and product procurement unit within Asia. We have three full-time senior electrical and computer engineers working on research and development of our products. Two full-time employees are working in the warehouse assembling electronics for Hydrofarm, orchestrating the development and distribution of our sensor devices and filters, contacting vendors when receiving orders for Hydrofarm, and performing warehouse logistics, product assembly, and other administrative tasks. We also have a full-time accounting manager/controller. Three employees perform audio/visual home installations for our subsidiary AVX, with one employee serving as the supervisor and operational head.
Legal Proceedings
On April 13, 2020, Ian Patterson resigned from his position as Chief Operations Officer of AVX. On May 5, 2020, Mr. Patterson filed an action in the Superior Court for the County of Los Angeles, State of California, against the Company et al. We believe neither the Company nor Dr. Wang has been served properly and venue is improper. The complaint alleges claims including wrongful termination, retaliation and various other provisions of the California Labor Code, and various other claims under California state law. The complaint seeks unspecified economic and non-economic losses, as well as attorneys’ fees. The Company is investigating and intends to vigorously defend itself in the foregoing matter. We have completed written discovery and non-expert discovery. Trial is set for May 31, 2022. AVX intends to vigorously contest this matter. Further, AVX disputes that the other defendants are proper parties to the litigation. However, litigation and investigations are inherently uncertain. Accordingly, the Company cannot predict the outcome of this matter.
On April 13, 2020, AVX terminated an employee from her position as Sales and Marketing Director. On May 13, 2020, she filed an action in the Superior Court for the County of Los Angeles, State of California. The Complaint alleges claims including wrongful termination, retaliation and various other provisions of the California Labor Code, and various other claims under California state law. The complaint seeks unspecified economic and non-economic losses, as well as attorneys’ fees. The Company is investigating and intends to vigorously defend itself in the foregoing matters. In response to the Complaint, defendants filed a motion to compel arbitration asking the court to order Plaintiff to submit her claims to binding individual arbitration based on an arbitration agreement signed by Plaintiff at the outset of her employment. The motion was unfortunately denied, and in response, defendants filed an appeal which is currently pending. The appeal is anticipated to take the majority of 2022 before it is resolved. AVX intends to vigorously contest this matter. Further, AVX disputes that the other defendants are proper parties to the litigation. However, litigation and investigations are inherently uncertain, but the outcome could have a material impact on the Company.
Reports to Securities Holders
We provide an annual report that includes audited financial information to our shareholders. We make our financial information equally available to any interested parties or investors through compliance with the disclosure rules for a small business issuer under the Exchange Act. We are subject to disclosure filing requirements including filing Form 10-K annually and Form 10-Q quarterly. In addition, we will file Form 8-K and other proxy and information statements from time to time as required. We do not intend to voluntarily file the above reports in the event that our obligation to file such reports is suspended under the Exchange Act. The public may read and copy any materials that we file with the Securities and Exchange Commission at the SEC’s Public Reference Room at 100 F Street NE, Washington, DC 20549.
The public may obtain information on the operation of the Public Reference Room by calling the SEC at 1-800-SEC-0330. The SEC maintains an Internet site (http://www.sec.gov) that contains reports, proxy and information statements, and other information regarding issuers that file electronically with the SEC.
| 27 |
Item 1A. RISK FACTORS
Risks Related to our Business and Industry
We have a history of operating losses, and we may not be able to sustain profitability.
We were incorporated on December 4, 2012; and as of December 31, 2021, we had an accumulated deficit of $12,937,091. If we are not successful in growing revenues and controlling costs, we will not maintain profitable operations or positive cash flow, and even if we achieve profitability in the future, we may not be able to sustain profitability in subsequent periods.
Because we have a limiting operating history with positive revenues, you may not be able to accurately evaluate our operations.
We were incorporated on December 4, 2012 and have had limited profitable operations to date. Therefore, we have a limited profitable operating history upon which to evaluate the merits of investing in our company. The likelihood of success must be considered in light of the problems, expenses, difficulties, complications and delays encountered in connection with the operations that we plan to undertake. These potential problems include, but are not limited to, unanticipated problems relating to the ability to generate sufficient cash flow to operate our business, and additional costs and expenses that may exceed current estimates. However, we expect to continue generating revenues. Additionally, we recognize that if the effectiveness of our business plan is not forthcoming, we will not be able to continue business operations. If we are unsuccessful in addressing these risks, our business will most likely fail.
We require significant funding to develop, manufacture and market our Ubiquitor wireless sensor.
We may ultimately require up to $20 million to fund the development, manufacturing, assembly and marketing strategy for the Ubiquitor. Once we achieve this fund-raising goal, we intend to position ourselves in the small device market, establishing the price at below a few hundred dollars. Due to superior functionality and low price, we expect to capture this section of the market fairly easily. Once our product and service matures, and the Company becomes better known, we believe we could gain market share in the high-end market. None of this will be possible if we fail to obtain the funding we require. There is no guarantee that additional funding can be obtained on favorable terms, if at all.
We depend on key personnel.
Our future success will depend in part on the continued service of key personnel, particularly, Desheng Wang, our Chief Executive Officer, and Edward Lee, the Chairman of our Board.
If any of our directors and officers choose to leave the company, we will face significant difficulties in attracting potential candidates for replacement of our key personnel due to our limited financial resources and operating history. In addition, the loss of any key employees or the inability to attract or retain qualified personnel could delay our plan of operations and harm our ability to provide services to our current customer, Hydrofarm, and harm the market’s perception of us.
Regulatory actions could limit our ability to market and sell our products.
Many of our products and the industries in which they are used are subject to U.S. and foreign regulation. Government regulatory action could greatly reduce the market for our Ubiquitor device and for smart home installation. For example, the power line grid, which is the communications grid that could be used by some of our products, is subject to special regulations in North America, Europe and Japan. In general, these regulations limit the ability of companies such as ours to use power lines as a communication medium. In addition, some of our competitors have attempted or may attempt to use regulatory actions to reduce the market opportunity for our products or to increase the market opportunity for their own products.
| 28 |
We outsource our product manufacturing and are susceptible to problems in connection with procurement, decreasing quality, reliability and protectability.
We assemble our Ubiquitor devices by using fully manufactured parts, the manufacturing of which has been fully outsourced. We have no direct control over the manufacturing processes of our products. This lack of control may increase quality or reliability risks and could limit our ability to quickly increase or decrease production rates.
Our business operations and financial performance may be affected by the coronavirus pandemic.
The coronavirus pandemic has adversely affected economies throughout the world. With the continued spread of the coronavirus in the United States and other countries, it is unclear how economic activity and workflow might be impacted on a worldwide basis generally or for our Company specifically. If the pandemic continues and/or conditions worsen, we may experience a disruption in our supply chain as well as a decline in sales activities and customer orders. The impact of the coronavirus on our operations is uncertain at this time. Given the rapidly changing situation related to this pandemic, we believe it could have a material adverse effect on our business, financial conditions and results of operations. During 2020, our subsidiary AVX was negatively impacted by the COVID-19 pandemic. AVX encountered delays in certain projects due to the government-imposed restrictions affecting access to job sites as well as clients contracting the coronavirus. We also had employees contract the virus, which negatively impacted our research and development. In 2021, we had delays in receiving the inventory necessary for Perfecular to fulfill sales orders due to a shortage of shipment containers caused by the pandemic, which resulted in delays in completing our sales cycles.
We outsource the manufacturing of key elements of our quantum light meters and air filters to a single manufacturing partner, with whom we do not have a formal contractual relationship.
We outsource the manufacture of our quantum light meter and air filtration devices to a single contract manufacturer, Tianjin Guanglee Technologies Ltd. (“Tianjin Guanglee”). If Tianjin Guanglee’s operations are interrupted or if Tianjin Guanglee is unable to meet our delivery requirements due to capacity limitations or other constraints, we may be limited in our ability to fulfill new customer orders, and we may be required to seek new manufacturing partners in the future. Tianjin Guanglee has limited manufacturing capacity, is itself dependent upon third-party suppliers and is dependent on trained technical labor to effectively create components making up our devices or to repair special tooling. In addition, as of the date of this report, we do not have a formal development and manufacturing agreement that regulates our business relationship with Tianjin Guanglee. Although we continue to operate under the terms of an oral agreement, and we believe there are a multitude of manufacturers that could quickly replace Tianjin Guanglee, our manufacturing operations could be adversely impacted if we are unable to enforce Tianjin Guanglee’s performance.
Our potential inability to adequately protect our intellectual property during the outsource manufacturing of our quantum light meters and filtration products in China could negatively impact our performance.
In connection with our manufacturing outsourcing arrangements, we rely on third-party manufacturers to implement customary manufacturer safeguards onsite, such as the use of confidentiality agreements with employees, to protect our proprietary information and technologies during the manufacturing process. However, these safeguards may not effectively prevent unauthorized use of such information and technical knowhow or prevent the manufacturers from retaining them. We face risks that our proprietary information may not be afforded the same protection in China as it is in countries with more comprehensive intellectual property laws, and local laws may not provide an adequate remedy in the event of unauthorized disclosure of confidential information. Costly and time-consuming litigation could be necessary to enforce and determine the scope of our proprietary rights in China, and failure to obtain or maintain intellectual property or trade secret protection could adversely affect our competitive business position. In the event that the third-party manufacturers of our proprietary products misappropriate our intellectual property, our business, prospects and financial condition could be materially and adversely affected.
| 29 |
Our business operations in China may negatively affect the ability to protect our intellectual property and our financial position.
On December 31, 2021, we set up a branch office in mainland China. Historically, China has not protected intellectual property rights to the same extent as the United States, and infringement of intellectual property rights continues to pose a serious risk of doing business in China. Monitoring and preventing unauthorized use is difficult. The measures we take to protect our intellectual property rights may not be adequate. Any unauthorized use of our intellectual property rights could harm our competitive advantages and business. Furthermore, the application of laws governing intellectual property rights in China is uncertain and evolving and could involve substantial risks to us. If we are unable to adequately protect our intellectual property rights, we may lose these rights and our business may suffer materially. Moreover, the complexities that arise from operating in a different tax jurisdiction inevitably lead to an increased exposure to international taxation. Should review of our tax filings result in unfavorable adjustments, our operating results, cash flows, and financial position could be materially and adversely affected.
The size and future growth in the market for our Ubiquitor device or our PLC technology has not been established with precision and may be smaller than we estimate, possibly materially. If our estimates and projections overestimate the size of this market, our sales growth may be adversely affected.
Our estimates of the size and future growth in the market for our Ubiquitor device or our PLC technology is based on a number of internal studies, reports and estimates. In addition, our internal estimates are based in large part on current feedback from clients using current generation technology and our belief is that the use and implementation of our technologies in the United States and worldwide will be extensive. While we believe we are using effective tools in estimating the total market for Ubiquitor device or our PLC technology, these estimates may not be correct and the conditions supporting our estimates may change at any time, thereby reducing the predictive accuracy of these underlying factors. The actual demand for our products or competitive products, could differ materially from our projections if our assumptions are incorrect. As a result, our estimates of the size and future growth in the market for the Ubiquitor device or our PLC technology may prove to be incorrect. If the demand is smaller than we have estimated, it may impair our projected sales growth and have an adverse impact on our business.
If we are unable to properly forecast future demand of our products, our production levels may not meet demands, which could negatively impact our operating results.
Our ability to manage our inventory levels to meet our customer’s demand for our products is important for our business. Our production levels and inventory management are based on demand estimates six to twelve months forward taking into account supply lead times, production capacity, timing of shipments, and dealer inventory levels. If we overestimate or underestimate demand for any of our products during a given season, we may not maintain appropriate inventory levels, which could negatively impact our net sales or working capital, hinder our ability to meet customer demand, or cause us to incur excess and obsolete inventory charges.
Demand for our Ubiquitor product may be affected by new entrants who copy our products and/or infringe on our intellectual property.
The ability to protect and enforce intellectual property rights varies across jurisdictions. An inability to preserve our intellectual property rights may adversely affect our financial performance. Competitors and others may also initiate litigation to challenge the validity of our intellectual property or allege that we infringe their intellectual property. We may be required to pay substantial damages if it is determined our products infringe on their intellectual property. We may also be required to develop an alternative, non-infringing product that could be costly and time-consuming, or acquire a license on terms that are not favorable to us. Protecting or defending against such claims could significantly increase our costs, divert management’s time and attention away from other business matters, and otherwise adversely affect our results of operations and financial condition.
| 30 |
Internal system or service failures, including as a result of cyber or other security incidents, could disrupt business operations, result in the loss of critical and confidential information, and adversely impact our reputation, our business, financial condition, results of operations and cash flows. Our connected products potentially expose our business to cybersecurity threats.
Some of our products connect to the internet and potentially expose our business to cybersecurity threats. Global cybersecurity threats and incidents can range from uncoordinated individual attempts to gain unauthorized access to our systems to sophisticated and targeted measures known as advanced persistent threats directed at our products, our customers and/or our third-party service providers, including cloud providers. There has been an increase in the frequency and sophistication of cyber and other security threats we face, and our customers are increasingly requiring cyber and other security protections and standards in our products, and we may incur additional costs to comply with such demands.
The potential consequences of a material cyber or other security incident include financial loss, reputational damage, negative media coverage, litigation with third parties, which in turn could adversely affect our competitiveness, business, financial condition, results of operations and cash flows.
Our sensor segment is subject to risks associated with operations that have a concentration of customers.
We only have one customer, Hydrofarm, who resells our digital light meters and sensors. There is no guarantee that this customer will remain solvent, and/or continue with the Company as it has in the past. Consequently, if we were to lose this customer, a material portion of our revenues in our sensor and digital light meter segment would be lost.
Our air filtration business segment could experience price fluctuations in raw materials, availability problems, and volatile demand.
The principal raw materials that we use are filter media, activated charcoal, perforated metal sheet, and certain other petroleum-based products, like plastics, rubber, and adhesives. Our cost of filter media can experience price fluctuations. Larger competitors can enter into selective supply arrangements with major suppliers that reduce medium-to-long-term volatility in costs. We cannot guarantee purchases in the volume that justifies such selective supply arrangements. Thus, we could be subject to price volatility.
Prices and availability for the electronic parts and plastics we need to assemble the Ubiquitor could fluctuate.
The principal raw materials that we use for our Ubiquitor device are standard industrial electronics parts and plastics that are generally easily available through a variety of U.S. domestic and foreign manufacturers. Such raw materials can experience price fluctuations due to a variety of factors, such as tariffs, import/export fees and delays, and availability. If there is scarcity, then larger competitors could be given purchasing priority with major suppliers that could make it so smaller companies like us experience volatility in costs and/or availability issues. Also, since we have not yet manufactured in large numbers, our management team might not have the expertise to mitigate such price fluctuations or availability concerns. Thus, suppliers could stop selling to us because of demand. Even though it is possible to find alternative suppliers, changing to new suppliers could delay production and affect the quality of certain products.
Changes in tariffs, import or export restrictions, Chinese regulations or other trade barriers may reduce gross margins.
We currently source products from manufacturers in China, including digital, analog, and quantum light meters, filtration products and certain components for our Ubiquitor device. Currently, the prices we offer to Hydrofarm are FOB (Free on Board) China. Only the cost of delivering the goods to the nearest port is included and Hydrofarm is responsible for the shipping from China and responsible for all other fees, including tariffs, associated with delivering the goods to the ultimate destination. If Hydrofarm changes the term to CIF (Cost, Insurance, and Freight) United States, then we would be responsible for the shipping costs and the tariff costs, which may reduce our gross margin. Thus, we may incur increases in costs due to changes in tariffs, import or export restrictions, other trade barriers, or unexpected changes in regulatory requirements, any of which could reduce our gross margins. Moreover, volatile economic conditions may impact the ability of our suppliers to make timely deliveries; and in the event that a supplier fails to make a delivery, there is no guarantee that we will be able to timely locate an alternative supplier of comparable quality at an acceptable price.
| 31 |
Since the beginning of 2018, there has been increasing rhetoric, in some cases coupled with legislative or executive action, from several U.S. and foreign leaders regarding tariffs against foreign imports of certain materials. It is difficult to anticipate the impact on our business caused by the proposed tariffs or whether the proposed changes in tariffs will materialize in the future. Given the relatively fluid regulatory environment in China and the United States, there could be additional tax, tariffs or other regulatory changes in the future. Any such changes could directly and materially adversely impact our business, financial condition, and operating results.
Our failure to respond to rapid change in the technology markets could cause us to lose revenue and harm our competitive position.
Our future success will depend significantly on our ability to develop and market new products that keep pace with technological developments and evolving industry standards for technology. We are currently developing products, including our Ubiquitor device, universal smart monitors and controllers, distributed shared universal smart home products, and smart products for the gardening industry, for MacOS, PC, as well as mobile operating systems such as Android and iOS, that transmit data over Wi-Fi signals, cellular signals, Bluetooth, certain power line systems, traditional wired systems, and other radio frequency systems that enable data transmission. Our delay or failure to develop or acquire technological improvements, adapt our products to technological changes or provide technology that appeals to our customers may cause us to lose customers and may prevent us from generating revenue which could ultimately cause us to cease operations.
Our business depends on our ability to keep manufacturing costs low; and we may lack the expertise necessary to negotiate and maintain favorable pricing, supply, business and credit terms with our potential vendors.
It may be difficult to negotiate or maintain favorable pricing, supply, business or credit terms with our potential vendors, suppliers and service providers. In addition, product manufacturing costs may increase if we fail to achieve anticipated volumes. There can be no assurance that we will be able to successfully manage these risks. In summary, we can offer no assurance that we will be able to obtain a sufficient (but not excess) supply of products on a timely and cost-effective basis. Our failure to do so would lead to a material adverse impact on our business.
Since wireless networks are susceptible to interference and other limitations, and one advantage of our Ubiquitor device and our USIP platform is that it can connect to wireless networks as one way to transmit data, wireless network limitations may reduce the competitive advantage of the Ubiquitor and USIP platform in the marketplace.
Our Ubiquitor and USIP platform relies on both wired and wireless networks to transmit data, which is a major advantage of the Ubiquitor device and the USIP platform. Wireless networks allow multiple users to access large amounts of information without the hassle of running wires to and from each IoT device. However, wireless networks have technological limitations and there are a number of disadvantages that our Ubiquitor device may face when using a wireless network. Wireless networks are typically expensive; it can cost up to four times more to set up a wireless network than to set up a wired network. The range of a wireless network is limited, and a typical wireless router will only allow individuals located within 150 to 300 feet to access the network. Wireless networks are extremely susceptible to interference from radio signals, radiation and other similar types of interference. Such interference may cause a wireless network to malfunction. Wireless networks can be accessed by any IoT device within range of the network’s signal so information transmitted through the network (including encrypted information) may be intercepted by unauthorized users. Wireless networks are typically slower than wired networks, sometimes even up to 10 times slower. Walls and floors can seriously limit the range of your wireless network. Since wireless networks have severe limitations, these limitations may reduce the competitive advantage that the Ubiquitor provides in the marketplace which might prevent widespread adoption.
| 32 |
Demand for our products is uncertain and depends on our currently unproven ability to create and maintain superior performance.
Our future operating results will depend upon our ability to provide our products or services and to operate profitably in an industry characterized by intense competition, rapid technological advances and low margins. This, in turn, will depend on a number of factors, including:
| · | Our ability to generate significant sales and profit margin from the Ubiquitor device; |
| · | Worldwide market conditions and demand for sensor devices and other products we may continue to add as we move forward; |
| · | Our success in meeting targeted availability dates for our products and services; |
| · | Our ability to develop and commercialize new intellectual property and to protect existing intellectual property; |
| · | Our ability to maintain profitable relationships with our distributors, retailers and other resellers; |
| · | Our ability to maintain an appropriate cost structure; |
| · | Our ability to attract and retain competent, motivated employees; |
| · | Our ability to comply with applicable legal requirements throughout the world; and |
| · | Our ability to successfully manage litigation, including enforcing our rights, protecting our interests and defending claims made against us. |
These factors are difficult to manage, satisfy and influence and we cannot provide any assurance that we will be able to generate significant demand for and sales of our products.
The Ubiquitor device could fail to gain traction in the marketplace for a number of reasons that would adversely impact our financial results and cause our investors to lose money.
Future rollout of the Ubiquitor entail numerous risks such as:
| · | Any lack of market acceptance of the Ubiquitor; |
| · | Failure to maintain acceptable arrangements with product suppliers, particularly in light of lower than anticipated volumes; |
| · | Manufacturing, technical, supplier, or quality-related delays, issues or concerns, including the loss of any key supplier or failure of any key supplier to deliver high quality products on time; |
| · | Competition; |
| · | Potential declines in demand for sensor devices; and |
| · | Risks that third parties may assert intellectual property claims against our products. |
In order to compete successfully, we must accurately forecast demand, closely monitor inventory levels, secure quality products, continuously drive down costs, meet aggressive product price and performance targets, create market demand for our brand and hold sufficient, but not excess, inventory.
| 33 |
Our Ubiquitor device greatly depends on the growth and adoption of the IoT market, and other next-generation internet and smartphone-based applications.
The Internet may ultimately prove not to be a viable commercial marketplace for IoT applications for a number of reasons, including:
| · | unwillingness of consumers to shift to and use other such next-generation Internet-based, smartphone-assisted applications; |
| · | refusal to purchase our products and services; |
| · | perception by end-users with respect to the quality of our wireless sensors in an industry historically dominated by wired sensors; |
| · | competition; |
| · | inadequate development of smartphone infrastructure to keep pace with increased levels of use; and |
| · | increased government regulations in a relatively unregulated marketplace. |
There is a risk that the market will not adapt to using the smartphone readout as a substitute platform for sensor devices, causing our products to fail in the marketplace.
The vast majority of products on the small sensor device market do not currently use smartphones to collect and analyze sensor data. There is no guarantee that using smartphone technology will cut production costs and be well received. If our USIP using smartphone technology is not well received, there is a risk that device manufacturers will develop new monitoring and operating components that are incompatible with our current platform instead of developing the traditional sensors that are compatible with our technology. Updating our platform to stay compatible with new components could increase our costs unexpectedly.
Using wireless transmission technologies such as Wi-Fi and Bluetooth may create security risks.
There is also a risk of failure based on the wireless transmission of data used by our smartphone platform. If there is instability in a wireless network, Bluetooth sensor, or other network problems that are out of our control, our new platform may not be well received. Our smartphone platform relies on the wireless transmission of data through Wi-Fi networks and Bluetooth sensors. These networks are often deemed less secure than a hard-wired network. The security of a wireless network is often out of our control. However, any breach of security could result in the market and sensor device manufacturers to fail to embrace our platform.
Our business involves the use, transmission and storage of confidential information, and the failure to properly safeguard such information could result in significant reputational harm.
We may at times collect, store and transmit information of, or on behalf of, our clients that may include certain types of confidential information that may be considered personal or sensitive, and that are subject to laws that apply to data breaches. We believe that we take reasonable steps to protect the security, integrity and confidentiality of the information we collect and store, but there is no guarantee that inadvertent or unauthorized disclosure will not occur or that third parties will not gain unauthorized access to this information despite our efforts to protect this information, including through a cyber-attack that circumvents existing security measures and compromises the data that we store. If such unauthorized disclosure or access does occur, we may be required to notify persons whose information was disclosed or accessed. Most states have enacted data breach notification laws and, in addition to federal laws that apply to certain types of information, such as financial information, federal legislation has been proposed that would establish broader federal obligations with respect to data breaches. We may also be subject to claims of breach of contract for such unauthorized disclosure or access, investigation and penalties by regulatory authorities and potential claims by persons whose information was disclosed. The unauthorized disclosure of information, or a cyber-security incident involving data that we store, may result in the termination of one or more of our commercial relationships or a reduction in client confidence and usage of our services. We may also be subject to litigation alleging the improper use, transmission or storage of confidential information, which could damage our reputation among our current and potential clients and cause us to lose business and revenue.
| 34 |
Product liability associated with the production, marketing and sale of our products, and/or the expense of defending against claims of product liability, could materially deplete our assets and generate negative publicity which could impair our reputation.
The production, marketing and sale of digital products have inherent risks of liability in the event of product failure or claim of harm caused by product operation. Furthermore, even meritless claims of product liability may be costly to defend against. We do not currently have product liability insurance for our products. We may not be able to obtain this insurance on acceptable terms or at all. Because we may not be able to obtain insurance that provides us with adequate protection against all or even some potential product liability claims, a successful claim against us could materially deplete our assets. Moreover, even if we are able to obtain adequate insurance, any claim against us could generate negative publicity, which could impair our reputation and adversely affect the demand for our products, our ability to generate sales and our profitability. For the products we sell through Hydrofarm, we also do not carry product liability insurance. It is our management’s position that these handheld battery-operated products do not carry substantial product liability risk and to the extent there are any product liability risks, such risks are born by Hydrofarm, who does carry product liability insurance coverage for the products we provide to them and they sell to their customers. However, it is possible that we could face liability in a products liability lawsuit for manufacturing defects or defective design since we design or manufacture the products sold by Hydrofarm.
Some of the agreements that we may enter into with manufacturers or distributors of our products and components of our products may require us:
| · | to obtain product liability insurance; or |
| · | to indemnify manufacturers against liabilities resulting from the sale of our products. |
If we are not able to obtain and maintain adequate product liability insurance, then we could be in breach of these agreements, which could materially adversely affect our ability to produce our products and generate revenues. Even if we are able to obtain and maintain product liability insurance, if a successful claim in excess of our insurance coverage is made, then we may have to indemnify some or all of our manufacturers or distributors for their losses, which could materially deplete our assets.
We may not be able to identify suitable acquisition targets or otherwise successfully implement a growth strategy reliant on mergers and acquisitions.
In order to expand our business, we hope to pursue mergers and acquisitions to acquire new or complementary businesses, services or technologies. We expect to continue evaluating potential strategic acquisitions of businesses, services and technologies. However, we may not be able to identify suitable candidates, negotiate appropriate or favorable acquisition terms, obtain financing that may be needed to consummate such transactions or complete proposed acquisitions. Any such future mergers and acquisitions would be accompanied by the risks commonly encountered in acquisitions of companies, including, among other things, the difficulty of integrating the operations and personnel of the acquired companies; the potential disruption of the Company’s ongoing business; the inability of management to incorporate successfully acquired technology and rights into the Company’s services and product offerings; additional expense associated with amortization of acquired intangible assets; the maintenance of uniform standards, controls, procedures and policies; and the potential impairment of relationships with employees, customers and strategic partners.
Our growth strategy includes licensing our intellectual property, and we run the risk that a licensee could become a competitor.
As part of our growth strategy, we anticipate licensing our intellectual property. Licensing our intellectual property could potentially damage our business if a licensee becomes a competitor, especially once the statutory rights to our intellectual property have expired or the licensing arrangement with a licensee has terminated. A licensee could develop modifications of our intellectual property and choose to compete with us in the marketplace. Litigation may be necessary to protect our rights to our intellectual property. Even if we are successful, litigation could result in substantial costs and be a distraction to our management team. If we are not successful, we could lose valuable intellectual property rights.
| 35 |
Product defects could result in costly fixes, litigation and damages.
Our business exposes us to potential product liability risks that are inherent in the design, manufacture and sale of our products. If there are claims related to defective products (under warranty or otherwise), particularly in a product recall situation, we could be faced with significant expenses in replacing or repairing the product. For example, our filtration products or Ubiquitor devices obtain raw materials, machined parts and other product components from suppliers who provide certifications of quality which we rely on. Should these product components be defective and pass undetected into finished products, or should a finished product contain a defect, we could incur significant costs for repairs, re-work and/or removal and replacement of the defective product. In addition, if a dispute over product claims cannot be settled, arbitration or litigation may result, requiring us to incur attorneys’ fees and exposing us to the potential of damage awards against us.
Only two officers have public company experience on our management team which could adversely impact our ability to comply with the reporting requirements of U.S. securities laws.
Amongst our officers, only Dr. Desheng Wang, our CEO, and Duncan Lee, our CFO, have public company experience. Our CEO and CFO are ultimately responsible for complying with federal securities laws and making required disclosures on a timely basis. Any such deficiencies, weaknesses or lack of compliance could have a materially adverse effect on our ability to comply with the reporting requirements of the Securities Exchange Act of 1934, as amended, which is necessary to maintain our public company status. If we were to fail to fulfill those obligations, our ability to continue as a U.S. public company would be in jeopardy in which event you could lose your entire investment in our Company.
Some of our officers, directors, consultants and advisors are involved in other businesses and not obligated to commit their time and attention exclusively to our business and therefore they may encounter conflicts of interest with respect to the allocation of time and business opportunities between our operations and those of other businesses.
Another example of a conflict of interest are so called “self-dealing” transactions. If a conflict-of-interest transaction is negotiated and approved, in a manner that approximates arms-length negotiations, the transaction is accepted unless a shareholder proves in court that the transaction is not entirely fair to the company or its shareholders. The burden is on the shareholder to show lack of entire fairness. A self-dealing transaction is considered invalid if challenged, unless the interested director proves in court that the transaction is entirely fair to the Company. The burden is on the director to show entire fairness.
If, as a result of these conflicts, we may be deprived of business opportunities or information, the execution of our business plan and our ability to effectively compete in the marketplace may be adversely affected. If our audit committee becomes aware of such conflict of interests, we will take an immediate action to resolve it. Each conflict of interest will be handled by the Company based on the nature of the conflict and the individual involved in it.
We are not aware of any current or potential conflict of interests with our consultants or advisors.
We have concluded that we have not maintained effective internal control over financial reporting through the years ended December 31, 2021 and December 31, 2020. Significant deficiencies and material weaknesses in our internal control could have material adverse effects on us.
It is important for us to maintain effective internal control over financial reporting, which is a process designed to provide reasonable assurance regarding the reliability of financial reporting and the preparation of financial statements for external purposes in accordance with generally accepted accounting principles. Because of its inherent limitations, internal control over financial reporting may not prevent or detect misstatements. Also, projections of any evaluation of effectiveness to future periods are subject to the risk that controls may become inadequate because of changes in conditions, or that the degree of compliance with the policies or procedures may deteriorate.
| 36 |
A material weakness is a deficiency, or combination of deficiencies, in internal control over financial reporting, such that there is a reasonable possibility that a material misstatement of the Company’s annual or interim financial statements will not be prevented or detected on a timely basis.
A material weakness in our internal control over financial reporting could adversely impact our ability to provide timely and accurate financial information. If we are unsuccessful in implementing or following our remediation plan, we may not be able to timely or accurately report our financial condition, results of operations or cash flows or maintain effective disclosure controls and procedures. If we are unable to report financial information timely and accurately or to maintain effective disclosure controls and procedures, we could be subject to, among other things, regulatory or enforcement actions by the SEC, any one of which could adversely affect our business prospects.
We currently have identified significant deficiencies in our internal control over financial reporting that, if not corrected, could result in material misstatements of our financial statements.
In connection with the audit of our financial statements as of and for the years ended December 31, 2021 and 2020, we identified significant deficiencies in our internal control over financial reporting and a general understanding of U.S. GAAP. As such, there is a reasonable possibility that a misstatement of our financial statements will not be prevented or detected on a timely basis.
As we have thus far not needed to comply with Section 404 of the Sarbanes-Oxley Act of 2002, as amended (the “Sarbanes-Oxley Act” or “SOX”), neither we nor our independent registered public accounting firm has performed an evaluation of our internal control over financial reporting in accordance with Section 404 of the Sarbanes-Oxley Act. In light of the deficiency, we believe that it is possible that certain control deficiencies may have been identified if such an evaluation had been performed.
We are working to remediate the deficiencies or material weaknesses. We have taken steps to enhance our internal control environment and plan to take additional steps to remediate the material weaknesses. For a discussion of our remediation plan, see “Management’s Report on Internal Control over Financial Reporting.”
Although we plan to complete this remediation process as quickly as possible, we are unable, at this time to estimate how long it will take; and our efforts may not be successful in remediating the deficiencies or material weaknesses.
Our executive officers and directors collectively have the power to control our management and operations and have a significant majority in voting power on all matters submitted to the stockholders of the Company.
Our CEO and one of our directors, Dr. Desheng Wang, owns 33.273% of the outstanding shares of our common stock as of the date of this report. Two of our directors together own over 50% of the outstanding shares of our common stock. Accordingly, our directors have a significant influence in determining the outcome of all corporate transactions or other matters, including mergers, consolidations and the sale of all or substantially all of our assets. They also have the power to prevent or cause a change in control. The interests of our directors may differ from the interests of the other stockholders and thus result in corporate decisions that are disadvantageous to other shareholders.
Management currently beneficially owns a majority of our outstanding common stock. Consequently, management has the ability to influence control of the operations of the Company and, acting together, will have the ability to influence or control substantially all matters submitted to stockholders for approval, including:
| · | Election of our board of directors; |
| · | Removal of directors; |
| · | Amendment to the Company’s Articles of Incorporation or Bylaws; and |
| · | Adoption of measures that could delay or prevent a change in control or impede a merger, takeover or other business combination. |
These stockholders have complete control over our affairs. Accordingly, this concentration of ownership by itself may have the effect of impeding a merger, consolidation, takeover or other business consolidation, or discouraging a potential acquirer from making a tender offer for the common stock.
| 37 |
If we fail to maintain an effective system of internal control over financial reporting, we may not be able to accurately report our financial results. As a result, current and potential shareholders could lose confidence in our financial reporting, which would harm our business and the trading price of our stock.
Members of our Board of Directors are inexperienced with U.S. GAAP and the related internal control procedures required of U.S. public companies. Management has determined that our internal audit function is also significantly deficient due to insufficient qualified resources to perform internal audit functions.
We are a smaller reporting company with limited resources. Therefore, we cannot assure investors that we will be able to maintain effective internal controls over financial reporting based on criteria set forth by the Committee of Sponsoring Organizations of the Treadway Commission (“COSO”) in Internal Control-Integrated Framework. A material weakness is a deficiency, or a combination of deficiencies, in internal control over financial reporting, such that there is a reasonable possibility that a material misstatement of the Company’s annual or interim financial statements will not be prevented or detected on a timely basis. The Company has deficiencies over financial statements in areas of recording revenue and expenses in proper cut off as well as proper classification of accounts. For these reasons, we are considering the costs and benefits associated with improving and documenting our disclosure controls and procedures and internal controls and procedures, which includes (i) hiring additional personnel with sufficient U.S. GAAP experience and (ii) implementing ongoing training in U.S. GAAP requirements for our CFO and accounting and other finance personnel. If the result of these efforts are not successful, or if material weaknesses are identified in our internal control over financial reporting, our management will be unable to report favorably as to the effectiveness of our internal control over financial reporting and/or our disclosure controls and procedures, and we could be required to further implement expensive and time-consuming remedial measures and potentially lose investor confidence in the accuracy and completeness of our financial reports which could have an adverse effect on our stock price and potentially subject us to litigation.
The requirements of being a public company may strain our resources and distract our management.
We are required to comply with various regulatory and reporting requirements, including those required by the Securities and Exchange Commission. Complying with these reporting and other regulatory requirements is time-consuming and may result in increased costs to us and could have a negative effect on our business, results of operations and financial condition.
As a public company, we are subject to the reporting requirements of the Securities Exchange Act of 1934, as amended, or the Exchange Act, and requirements of the Sarbanes-Oxley Act of 2002, as amended, or SOX. These requirements may place a strain on our systems and resources. The Exchange Act requires that we file annual, quarterly and current reports with respect to our business and financial condition. SOX requires that we maintain effective disclosure controls and procedures and internal controls over financial reporting. Compliance with these rules and regulations will increase our legal and financial compliance costs, make some activities more difficult, time-consuming or costly and increase demand on our systems and resources.
These activities may divert management’s attention from other business concerns, which could have a material adverse effect on our business and results of operations.
In addition, changing laws, regulations and standards relating to corporate governance and public disclosure are creating uncertainty for public companies, increasing legal and financial compliance costs and making some activities more time consuming. These laws, regulations and standards are subject to varying interpretations, in many cases due to their lack of specificity, and, as a result, their application in practice may evolve over time as new guidance is provided by regulatory and governing bodies. This could result in continuing uncertainty regarding compliance matters and higher costs necessitated by ongoing revisions to disclosure and governance practices. We intend to invest resources to comply with evolving laws, regulations and standards, and this investment may result in increased general and administrative expenses and a diversion of management’s time and attention from revenue-generating activities to compliance activities. If our efforts to comply with new laws, regulations and standards differ from the activities intended by regulatory or governing bodies due to ambiguities related to practice, regulatory authorities may initiate legal proceedings against us and our business may be harmed.
We also expect that being a public company and these new rules and regulations will make it more expensive for us to obtain director and officer liability insurance, and we may be required to accept reduced coverage or incur substantially higher costs to obtain coverage. These factors could also make it more difficult for us to attract and retain qualified members of our Board of Directors, particularly to serve on our audit committee and compensation committee, and qualified executive officers.
| 38 |
Risks Related to the Ownership of our Common Stock
An increase of free trading shares of our common stock could result in substantial sales of common stock on the open market which could cause our stock price to fall substantially.
In 2018, we registered 19,904,706 shares of our common stock for more than 300 shareholders, which is substantially more than the 18,018,039 shares of common stock that are currently free trading. Any increase in freely trading shares, or the perception that such shares will or could come onto the market could have an adverse effect on the trading price of the stock. No prediction can be made as to the effect, if any, that sales of these shares, or the availability of such shares for sale, will have on the market prices prevailing from time to time. Nevertheless, the possibility that substantial amounts of common stock may be sold in the public market may adversely affect prevailing market prices for our common stock and could impair our ability to raise capital through the sale of our equity securities or impair our shareholders’ ability to sell on the open market.
You could be diluted from our future issuance of capital stock and derivative securities.
As of December 31, 2021, we had 43,259,741 shares of common stock outstanding and no shares of preferred stock outstanding. We are authorized to issue up to 75,000,000 shares of common stock and no shares of preferred stock. To the extent of such authorization, our Board of Directors will have the ability, without seeking stockholder approval, to issue additional shares of common stock or preferred stock in the future for such consideration as the Board of Directors may consider sufficient. The issuance of additional common stock or preferred stock in the future may reduce a shareholder’s proportionate ownership and voting power.
Substantial future sales of our common stock, or the perception in the public markets that these sales may occur, may depress our stock price.
Sales of substantial shares of our common stock in the public market, or the perception that these sales could occur, could adversely affect the price of our common stock and could impair our ability to raise capital through the sale of additional shares.
In the future, we may issue our securities if we need to raise capital in connection with a capital raise or acquisitions. The number of shares of our common stock issued in connection with a capital raise or acquisition could constitute a material portion of our then-outstanding shares of our common stock and have a dilutive effect on our shareholders which could have a material negative effect on our stock price.
Future sales of our common stock by existing stockholders could cause our stock price to decline.
If our existing stockholders sell substantial shares of our common stock in the public market, then the market price of our common stock could decrease significantly. The perception in the public market that our stockholders might sell shares of common stock also could depress the market price of our common stock. There are approximately 43,259,741 shares of our common stock outstanding, of which approximately 18,018,309 shares are currently freely tradable.
Certain existing holders of a majority of our common stock have rights, subject to certain conditions, to require us to file registration statements covering their shares or to include their shares in registration statements that we may file for ourselves or other shareholders. If the sale of these shares are registered, they will be freely tradable without restriction under the Securities Act. In the event such registration rights are exercised and a large number of shares of common stock are sold in the public market, such sales could reduce the trading price of our common stock.
A decline in the price of shares of our common stock might impede our ability to raise capital through the issuance of additional shares of our common stock or other equity securities.
We do not intend to pay dividends and there will be less ways in which you can make a gain on any investment in Focus Universal Inc.
We have never paid any cash dividends and currently do not intend to pay any dividends for the foreseeable future. To the extent that we require additional funding currently not provided for in our financing plan, our funding sources may likely prohibit the payment of a dividend. Because we do not intend to declare dividends, any gain on an investment in Focus Universal Inc. will need to come through appreciation of the stock’s price.
| 39 |
Sales of a substantial number of shares of our common stock in the public market by certain of our shareholders could cause our stock price to fall.
Sales of a substantial number of shares of our common stock in the public market, or the perception that these sales might occur, could depress the market price of our common stock and could impair our ability to raise capital through the sale of additional equity securities. We are unable to predict the effect that sales may have on the prevailing market price of shares of our common stock.
An active trading market for our common stock may not be maintained.
Our common stock is currently listed on the Nasdaq Global Market under the symbol “FCUV,” but we can provide no assurance that we will be able to maintain an active trading market on this or any other exchange in the future. A lack of an active market may impair the ability of our stockholders to sell shares at the time they wish to sell or at a price that they consider favorable. The lack of an active market may also reduce the fair market value of our common stock, impair our ability to raise capital by selling shares of capital stock and may impair our ability to use common stock as consideration to attract and retain talent or engage in business transactions (including mergers and acquisitions). In 2021, our common stock was listed on the Nasdaq Capital Market. Our stock was uplisted onto the Nasdaq Global Market on January 28, 2022.
Our shares of common stock are only recently listed on NASDAQ, and we may not be able to maintain the continued listing standards.
NASDAQ requires companies to fulfill specific requirements in order for their shares to continue to be listed. There is no guarantee that our common stock will maintain NASDAQ continued listing standards and we may be delisted. If our common stock is delisted from NASDAQ, our shareholders could find it difficult to sell their common stock.
In the event that the shares of our common stock were to be delisted from NASDAQ, we expect that it would be traded on the OTCQB or OTCQX marketplaces, which are unorganized, inter-dealer, over-the-counter markets that provide significantly less liquidity than NASDAQ or other national securities exchanges. Thus, a delisting from NASDAQ may have a material adverse effect on the trading and price of our common stock.
If we are unable to maintain compliance with NASDAQ continued listing standards, including maintenance of at least $2.5 million of stockholders’ equity and maintenance of a $1.00 minimum bid price, our common stock may be delisted from NASDAQ.
There can be no assurances that we will be able to maintain our NASDAQ listing in the future. In the event we are unable to maintain compliance with NASDAQ continued listing standards and our common stock is delisted from NASDAQ, it could likely lead to a number of negative implications, including an adverse effect on the price of our common stock, reduced liquidity in our common stock, the loss of federal preemption of state securities laws and greater difficulty in obtaining financing. In the event of a delisting, we would take actions to restore our compliance with NASDAQ’s continued listing standards, but we can provide no assurance that any such action taken by us would allow our common stock to become listed again, stabilize the market price or improve the liquidity of our common stock, prevent our common stock from dropping below the NASDAQ minimum bid price requirement or prevent future non-compliance with NASDAQ’s continued listing requirements.
Risks Related to Our Acquisition of AVX
If we are unable to manage our anticipated post-acquisition growth effectively, our business could be adversely affected.
We anticipate that as a result of the significant expansion of our operations and addition of operating subsidiaries, new personnel may be required in all areas of our operations in order to continue to implement our post-acquisition business plan. Our future operating results depend to a large extent on our ability to manage this expansion and growth successfully. For us to continue to manage such growth, we must put in place legal and accounting systems and implement human resource management and other tools. We have taken preliminary steps to put this structure in place. However, there is no assurance that we will be able to successfully manage this anticipated rapid growth. A failure to manage our growth effectively could materially and adversely affect our profitability.
| 40 |
Increasing competition within our industry could have an impact on our business prospects.
The IoT market is a growing industry where new competitors are entering the market frequently. These competing companies may have significantly greater financial and other resources than we have and may have been developing their products and services longer than we have been developing ours. Although our portfolio of products and related revenue stream sources are broad, increasing competition may have a negative impact on our profit margins.
The success of our smart home installation business will depend upon the efforts of management of our subsidiary AVX.
Only one key member of management has remained with AVX following the business combination, we can offer no assurance that we will be able to retain them or effectively recruit new additional personnel. The departure of any key members of AVX’s management team could make it more difficult to operate AVX. Moreover, to the extent that we will rely upon their management team to operate AVX, we will be subject to risks regarding their managerial competence. Accordingly, we cannot assure you that our assessment of these individuals will prove to be correct and that they will have the skills, abilities and qualifications we expect.
If we are unable to integrate the Ubiquitor device into the smart home installation business, we may not be able to distinguish ourselves in the segment and that could negatively affect our ability to operate in the competitive smart home installation industry.
The smart home installation business is a highly competitive market, and we have numerous competitors who are already well-established in the market. We expect our competitors to continue improving the design and performance of their products and to introduce new products that could be competitive in both price and performance. The reason we believe that we could become competitive in this market segment is because we anticipate integrating the Ubiquitor device into AVX’s smart home installations. However, there is no guarantee that we can integrate the Ubiquitor device into AVX’s smart home installations. If we are unable to integrate the Ubiquitor device into smart home installations, we will not be able to achieve the competitive price and performance we anticipate to achieve success in AVX’s future smart home installations. Alternatively, we may not be able to achieve a smart home installation at a cost-effective price that is sufficient to distinguish us from amongst the competition in this market segment.
Risks Related to the COVID-19 Pandemic
The recent COVID-19 pandemic may adversely affect our business, results of operations, financial condition, liquidity, and cash flow.
On March 11, 2020, the World Health Organization declared COVID-19 a pandemic. The pandemic has impacted and may further impact the United States and the broader economies of affected countries, including negatively impacting economic growth, the proper functioning of financial and capital markets, foreign currency exchange rates and interest rates. Due to the speed with which the situation is developing, the global breadth of its spread and the range of governmental and community reactions thereto, there is uncertainty around its duration, ultimate impact and the timing of recovery. Therefore, the pandemic could lead to an extended disruption of economic activity and the impact on our consolidated results of operations, financial position, and cash flows could be material.
As a result of the adverse impact that the COVID-19 pandemic is having on our economy and the economies of the countries in which we plan to do business, the pandemic has affected and may continue to affect our operations, including our supply chain distribution systems, production levels and research and development activities. In addition, any preventive or protective actions that governments implement or that we adopt in response to the COVID-19 pandemic, such as travel restrictions, quarantines, and limited operations of governmental agencies, may interfere with the ability of our employees, vendors, and suppliers to perform their respective responsibilities and obligations relative to the conduct of our business. Additionally, government regulations that have been imposed in response to the COVID-19 pandemic may cause delays in our freight processes, which would result in higher shipping costs. In addition, social distancing guidelines could have an adverse impact on our research and development activities as our laboratories are not operating at full capacity.
| 41 |
The impact of the COVID-19 pandemic on the global financial markets may reduce our ability to access capital, which could negatively impact our short-term and long-term liquidity. Further, the resulting global economic downturn has negatively impacted the ability of certain of our customers to make payments on a timely basis, adversely impacting our cash flows from operations. We do not yet know the full extent of the impact of the COVID-19 pandemic or its resulting economic impact, which could have a material adverse effect on our liquidity, capital resources, operations, and business.
We are also monitoring the impact of COVID-19 on our talent recruitment and retention efforts. If members of our management and other key personnel in critical functions across our organization are unable to perform their duties or have limited availability due to COVID-19, we may not be able to execute on our business strategy and/or our operations may be negatively impacted. The loss or limited availability of the services of one or more of our executive officers or other key personnel, or our inability to recruit and retain qualified executive officers or other key personnel in the future could, at least temporarily, have a material adverse effect on our business, financial condition, and results of operations. Qualified individuals are in high demand, and we may incur significant costs to attract them, particularly at the executive level. We may face difficulty in attracting and retaining key talent for a number of reasons, including delays in the recruiting and hiring process as a result of the COVID-19 pandemic.
Our business, financial condition, and results of operations could be materially adversely affected by unfavorable results in future employment litigation matters as a result of COVID-19. Our employees may sue us due to possible exposure to COVID-19 while working at one of our facilities or sites. In addition, employees may challenge decisions to implement protective measures such as contact tracing on the basis of local privacy laws due to the increased collection of employee medical information. Litigation matters, regardless of their merits or their ultimate outcomes, are costly, divert management’s attention and may materially adversely affect our reputation and demand for our products. We cannot predict with certainty the eventual outcome of litigation matters. An adverse outcome of litigation or legal matters could result in us being responsible for paying significant damages.
Any of these negative effects resulting from litigation matters could materially adversely affect our business, financial condition or results of operations. To the extent the COVID-19 pandemic adversely affects our business and financial results, it may also have the effect of heightening many of the other risks described in this report.
The extent to which COVID-19 impacts our results will depend on future developments, which are highly uncertain and cannot be predicted, including new information which may emerge concerning the severity of COVID-19 and the actions taken to contain it or treat its impact.
Item 1B. UNRESOLVED STAFF COMMENTS
None.
Item 2. PROPERTIES
In September 2018, we purchased a manufacturing warehouse and office space addressed at 2311 East Locust Court, Ontario, CA, 91761. The property consists of an industrial type, two-story building, with a total building area of 30,740 square feet. Ten thousand square feet will be utilized for office space; and 20,000 square feet for warehouse space. The property includes 58 parking spaces. The purchase price for the property was approximately $4.62 million dollars.
Item 3. LEGAL PROCEEDINGS
On April 13, 2020, Ian Patterson resigned from his position as Chief Operations Officer of AVX. On May 5, 2020, Mr. Patterson filed an action in the Superior Court for the County of Los Angeles, State of California, against the Company et al. We believe neither the Company nor Dr. Wang has been served properly and venue is improper. The complaint alleges claims including wrongful termination, retaliation and various other provisions of the California Labor Code, and various other claims under California state law. The complaint seeks unspecified economic and non-economic losses, as well as attorneys’ fees. The Company is investigating and intends to vigorously defend itself in the foregoing matter. We have completed written discovery and non-expert discovery. Trial is set for May 31, 2022. AVX intends to vigorously contest this matter. Further, AVX disputes that the other defendants are proper parties to the litigation. However, litigation and investigations are inherently uncertain. Accordingly, the Company cannot predict the outcome of this matter.
| 42 |
On April 13, 2020, AVX terminated an employee from her position as Sales and Marketing Director. On May 13, 2020, she filed an action in the Superior Court for the County of Los Angeles, State of California. The Complaint alleges claims including wrongful termination, retaliation and various other provisions of the California Labor Code, and various other claims under California state law. The complaint seeks unspecified economic and non-economic losses, as well as attorneys’ fees. The Company is investigating and intends to vigorously defend itself in the foregoing matters. In response to the Complaint, defendants filed a motion to compel arbitration asking the court to order Plaintiff to submit her claims to binding individual arbitration based on an arbitration agreement signed by Plaintiff at the outset of her employment. The motion was denied, and in response, defendants filed an appeal which is currently pending. The appeal is anticipated to take the majority of 2022 before it is resolved. AVX intends to vigorously contest this matter. Further, AVX disputes that the other defendants are proper parties to the litigation. However, litigation and investigations are inherently uncertain, but the outcome could have a material impact on the Company.
Item 4. MINE SAFETY DISCLOSURES
Not applicable to our Company.
| 43 |
PART II
Item 5. MARKET FOR REGISTRANT’S COMMON EQUITY, RELATED STOCKHOLDER MATTERS AND ISSUER PURCHASES OF EQUITY SECURITIES.
Market Information
On August 31, 2021, the Company commenced the trading of its common stock on the Nasdaq Capital Market under the symbol “FCUV.” On January 28, 2022, the Company commenced trading of its common stock on the Nasdaq Global Market under the symbol “FCUV.” On March 7, 2022, the last reported sale price of our common stock as reported on the Nasdaq Capital Market was $9.10 per share.
On September 23, 2014, our common stock was verified for trading on the OTCQB Market under the trading symbol “FCUV.” Prior to that time, there was no public market for our stock. The following table sets forth for the indicated periods the high and low intra-day sales price per share for our common stock on the OTCQB Market for the four quarters of 2020 and on the OTCQB Market and the Nasdaq Capital Market (as applicable) for the four quarters of 2021. As of January 28, 2022, our common stock trades upon the Nasdaq Global Market.
| High | Low | |||||||
| 2020: First Quarter | $ | 5.00 | $ | 2.50 | ||||
| 2020: Second Quarter | $ | 4.50 | $ | 3.67 | ||||
| 2020: Third Quarter | $ | 3.67 | $ | 1.50 | ||||
| 2020: Fourth Quarter | $ | 3.50 | $ | 2.00* | ||||
| 2021: First Quarter | $ | 4.25 | $ | 3.56 | ||||
| 2021: Second Quarter | $ | 10.00 | $ | 4.25 | ||||
| 2021: Third Quarter | $ | 25.25 | $ | 4.49 | ||||
| 2021: Fourth Quarter | $ | 15.52 | $ | 7.33 | ||||
________________
*It appears that on November 2, 2020, there was an intraday bid price as low as $0.20 per share, but it is unclear if that order was filled and the stock opened and closed at $2.00 that day.
Holders.
As of March 8, 2022, there were 396 record holders of 43,259,741 shares of the Company’s common stock. The number of record holders was determined from the records of our transfer agent and does not include beneficial owners of common stock whose shares are held in the names of various security brokers, dealers, and registered clearing agencies. The transfer agent of our common stock is VStock Transfer, LLC.
Dividends.
The Company has not paid any cash dividends to date and does not anticipate or contemplate paying dividends in the foreseeable future. It is the present intention of management to utilize all available funds for the development of the Company’s business. However, we cannot provide any assurance that we will or will not declare or pay cash dividends on our common stock. Any future determination to declare cash dividends will be made at the discretion of our Board of Directors, subject to applicable laws, and will depend on our financial condition, results of operations, capital requirements, general business conditions and other factors that our Board of Directors may deem relevant.
| 44 |
Securities Authorized for Issuance Under Equity Compensation Plans
On December 15, 2018, our Board of Directors presented the 2018 Equity Incentive Plan to the shareholders. On December 17, 2018, the holders of 63.051% of our issued and outstanding shares of common stock adopted a resolution by written consent without a meeting adopting the 2018 Equity Incentive Plan. The plan reserves an aggregate of 1,000,000 shares of the Company’s common stock, which provides for the payment of various forms of incentive compensation to employees, consultants, executives, and directors of the Company. The 2018 Equity Incentive Plan provides for the grant of the following types of stock awards: (i) incentive stock options; (ii) nonstatutory stock options; (iii) stock appreciation rights; (iv) restricted stock awards; (v) restricted stock unit awards; and (vi) other stock awards. Under the 2018 Equity Incentive Plan, a ten percent stockholder will not be granted an incentive stock option unless the exercise price of such option is at least one hundred and ten percent of the fair market value on the date of grant and the option is not exercisable after the expiration of five years from the grant date. The Board of Directors determines the vesting schedule of the grants with broad discretion. On August 6, 2019, each member of the Board was granted 30,000 options to purchase shares at $5.70 per share. On December 11, 2020, each member of the Board was granted 15,000 options to purchase shares at $3.00 per share. On December 31, 2021, each member of the Board was granted 15,000 options to purchase shares at $8.86 per share.
Recent sales of unregistered securities.
None.
Issuer Purchases of Equity Securities
We did not repurchase any of our equity securities during the years ended December 31, 2021, 2020, 2019, 2018, 2017, the nine months ended December 31, 2016, the year ended March 31, 2016, 2015, 2014 or the period from December 4, 2012 (inception) to March 31, 2013.
Item 6. [RESERVED]
Item 7. MANAGEMENT’S DISCUSSION AND ANALYSIS OF FINANCIAL CONDITION AND RESULTS OF OPERATIONS
The following discussion should be read in conjunction with our audited financial statements and notes thereto included herein. In connection with, and because we desire to take advantage of, the “safe harbor” provisions of the Private Securities Litigation Reform Act of 1995, we caution readers regarding certain forward-looking statements in the following discussion and elsewhere in this report and in any other statement made by, or on our behalf, whether or not in future filings with the Securities and Exchange Commission. Forward-looking statements are statements not based on historical information and which relate to future operations, strategies, financial results or other developments. Forward-looking statements are necessarily based upon estimates and assumptions that are inherently subject to significant business, economic and competitive uncertainties and contingencies, many of which are beyond our control and many of which, with respect to future business decisions, are subject to change. These uncertainties and contingencies can affect actual results and could cause actual results to differ materially from those expressed in any forward-looking statements made by, or our behalf. We disclaim any obligation to update forward-looking statements.
Focus Universal Inc., a Nevada corporation (the “Company,” “we,” “us,” or “our”), has developed five proprietary platform technologies that we believe solve the most fundamental problems plaguing the internet of things (“IoT”) industry by: (1) increasing the overall degree of chip integration capabilities by shifting integration from the component level directly to the device level; (2) creating a faster 5G cellular technology by using ultra-narrowband technology; (3) leveraging ultra-narrowband power line communication (“PLC”) technology; (4) developing a natural integrated programming language (“NIPL”) applied to software development, which generates a user interface through machine auto generation technology, and (5) developing a universal smart instrumentation platform (“USIP”).
| 45 |
In addition to the abovementioned technologies that we have developed, we provide sensor devices and are a wholesaler of various digital, analog, and quantum light meters and filtration products, including fan speed adjusters, carbon filters and HEPA filtration systems. We source these products from manufacturers in China and then sell them to a major U.S. distributor, Hydrofarm, who resells our products directly to consumers through retail distribution channels and, in some cases, places its own branding on our products. For the years ended December 31, 2021 and 2020, we generated a significant amount of our revenue from sales of a broad selection of agricultural sensors and measurement equipment, which is currently our primary business.
For a greater description of our technologies, our business segments and the products we are currently selling, see “Part I – Item 1. Business” above.
Ubiquitor Wireless Universal Sensor Device
Our USIP technology is an advanced software and hardware integrated instrumentation platform that uses a large-scale modular design approach. The large-scale modular design approach subdivides instruments into a foundation component (a USIP) and architecture-specific components (sensor nodes), which together replaces the functions of traditional instruments at a fraction of their cost. The USIP has an open architecture, incorporating a variety of individual instrument functions, sensors, and probes from different industries and vendors. The platform features the ability to connect potentially thousands of different sensors or probes, addressing major limitations present in traditional instrumentation systems. We believe the platform represents a technological advancement in the IoT marketplace by integrating large numbers of technologies, including cloud technology, wired and wireless communication technology, software programming, instrumentation technology, artificial intelligence, PLC, and sensor networking into a single platform. The result of such integration is a smaller, cheaper and faster circuit system design than those currently offered in the instrumentation market.
The USIP, which is compatible with a significant percentage of the instruments currently manufactured, consists of universal and reusable hardware and software. The universal hardware in the USIP is (i) a smartphone, computer, or any mobile device capable of running our software that includes a display and either hardware controls or software control surfaces, and (ii) our Ubiquitor, which is designed to be the universal data logger that acts as a bridge between the computer or mobile device and the sensor nodes. We call our flagship USIP device the “Ubiquitor” due to its ability to measure and test a variety of electrical and physical phenomena such as voltage, current, temperature, pressure, sound, light, and humidity—both wired and wirelessly.
We have created and assembled prototype models of the Ubiquitor in limited quantities and plan to expand our assembly in 2022. Our prototype Ubiquitor is compatible with standard desktop computers running either Windows OS or MacOS and Android- or iOS-based mobile devices and acts as a conduit that communicates with a group of sensors or probes manufactured by different vendors in a manner that requires the user to have little or no knowledge of their unique specifications. The data readout is displayed on the computer or mobile device display in application software we have created for use with a Windows PC and are creating for use with a Mac. We are designing the application software (the “App”) to have a graphical representation of control and indicator elements common in traditional tangible instruments, such as knobs, buttons, dials, and graphs, etc. Utilizing the Ubiquitor and the App, users and instrument manufacturers will be free to add, remove, or change a sensor module for their special industrial or educational application without creating their own application software and designing their own hardware. Our developers are designing and implementing a soft control touch screen interface that supports real-time data monitoring and facilitates instrument control and operation.
The Company continues to devote a substantial number of resources to research and development despite a slight decrease to the overall number year over year to bring the Ubiquitor and its App to full production and distribution. We anticipate that the sales and marketing involved with bringing the Ubiquitor to market will require us to hire a number of new employees in order to gain traction in the market. We intend to introduce the Ubiquitor in smart home installations to reduce costs and increase functionality, as well as implement the Ubiquitor device in greenhouses and other agricultural warehouses that require regulation of light, humidity, moisture, and other measurable scientific units required to create optimal growing conditions.
Our universal smart development protocol focuses not only on the design of the hardware and software modules but also on the design of the overall universal smart instruments system, guided by the principles of structure, universality and modularity.
| 46 |
Our Ubiquitor device is a fully modular system with a universal sensor node and gateway system that uses a computer or mobile device as the output display module responsible for displaying the readings of various sensor nodes. We have completed an initial production run of prototype Ubiquitor devices and intend to proceed into full-scale production. The Ubiquitor’s sensor analytics system integrates event-monitoring, storage and analytics software in a cohesive package that provides a holistic view of the sensor data it is reading.
The physical hardware consists of:
| 1. | The sensor nodes, which come in hundreds of different varieties of sensor instruments in the form of a USB stick, with both male and female ports; and |
| 2. | The Ubiquitor as the main hardware gateway, which is a small cell phone-sized device with integrated circuits. |

We believe the Ubiquitor device can connect up to thousands of potential sensor nodes, and integrate data using embedded software to display the data and all analytics onto a digital screen (desktop, smartphone or mobile device displays) using a Wi-Fi connection. As disclosed in our patent application, we have already tested up to 256 sensor instrument readouts. Most types of nodes and probes can connect to the hardware. If the sensor size is bigger than the standard probe size, it is possible to simply use a USB cable to connect the probe and the hub. All data and analytics are displayed on a single screen, with tools that record and keep track of all measurements, and sort and display analytic information in easy-to-read charts.
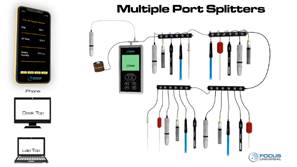
The Ubiquitor is a general platform that collects data in real time, and is intended to be adapted to many industrial uses.
By using the universal hardware or USIP, we believe we could achieve the following efficiencies in instrumentation systems:
| 1. | Cut production costs. Smartphone technology is widely used on the small sensor device market. By utilizing smartphone technology, the Ubiquitor will add superior functionality and performance, while cutting manufacturing and production costs. |
| 2. | Reduce the effort required to develop a new sensor product. With the Ubiquitor, we believe that there will be no need for device manufacturers to research and develop new monitoring and operating components because they will just need to develop new sensor nodes or probes that may be integrated into our software technology. |
| 3. | Reduce clutter. It is anticipated that the Ubiquitor could also dispense with some of the hassle of connecting cables, since the Ubiquitor allows wired and wireless transmission of sensor data and may allow wireless access to networks, such as a PLC network. |
| 47 |
Also, we plan to design a full line of products for the gardening industry by integrating the Ubiquitor device into a gardening system. The system would include the Ubiquitor connected to a light control node, temperature sensor, humidity sensor, digital light sensor, quantum PAR sensor, pH sensor, total dissolved solids (“TDS”) sensor and carbon dioxide sensor. We believe the combination of the Ubiquitor with these sensors would offer the same features as a combination of dozens or even hundreds of different standalone instruments in the gardening industry. The Ubiquitor-powered gardening system would be used to replace these standalone devices and could offer another case study of the effectiveness of the application of universal smart technology to such systems.
The development of universal smart instruments and the IoT have a considerable amount of overlap, with the only difference being the number of sensor nodes involved. We plan to take advantage of this overlap and unify universal smart instruments and the IoT into a single system, building the IoT infrastructure for both residential and commercial uses and charging monthly subscription fees. End users will be able to plug any peripheral devices into the power outlet and enjoy the IoT connectivity throughout their home or business.
Research and Development Efforts of Power Line Communication
Power Line Communication (“PLC”) is a communication technology that enables sending data over existing power cables. One advantage of this technology is that PLC does not require substantial new investment for its communications infrastructure. Rather, PLC utilizes existing power lines, thereby forming a distribution network that penetrates most residential, commercial and industrial premises. Accordingly, connectivity via PLC is a cost-effective and scalable interconnectivity approach for the IoT. We believe PLC can be an integral part of our communication infrastructure for the IoT, which enables reliable, real-time measurements, monitoring and control. A large variety of appliances may be interconnected by transmitting data through the same wires that provide electrical energy.
We are currently developing a wired alternative to wireless networks that utilizes installed power lines to transmit information. Our PLC technology uses an ultra-narrowband spectrum channel of less than 1 KHz to establish a long-distance link between transmitter and receiver. Thus, we believe that our proprietary ultra-narrowband PLC technology will offer a promising alternative to wireless networks and provide the backbone communication infrastructure for IoT devices.
The primary design goal of the power line network is electric power distribution, not data transmission. The harsh electrical noise present on power lines and variations in equipment and standards make data transmission over the power grid difficult. These technological challenges have impeded, or even halted, progression of PLC technology.
We continue to build upon our existing research and development with the intention of inventing an ultra-narrowband PLC technology that attempts to tackle two challenges: 1) overcoming interference caused by electronic noise on the power line system; and 2) bandwidth. Preliminary internal testing suggests that we have achieved significant noise rejection and interference suppression. In our preliminary internal testing, we have been able to increase bandwidth to 4 megabits per second with the potential for more, while simultaneously effectively dealing with electrical noise and interference. Such data transfer rates were delivered at a bandwidth of less than 1000 Hz, thereby achieving a bandwidth efficiency (measured as bits per second per Hz) greater than 4000. Based on the promising results of our internal testing, we have begun designing a proprietary PLC microchip and have set an intended launch date for 2022.
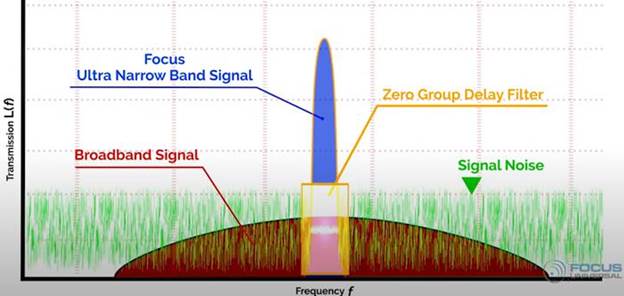
| 48 |
We believe that because residential and commercial structures already include multiple power outlets, the power line infrastructure represents an excellent network to share data among intelligent devices, particularly in the smart home installations that we are currently performing through AVX.
We plan to leverage the communications technology of PLC to enhance the Ubiquitor and make the Ubiquitor a central component of the smart home and gardening systems we are currently developing. The goal would be that our Ubiquitor would be used to send or receive control signals from a smart device, and control hundreds of devices in near real time. We intend to apply the same concept to commercial and industrial applications.
On December 23, 2021, Focus Universal (Shenzhen) Technology Co. LTD was founded as a mainland China office for manufacturing procurement expertise and support research and development activities. Focus Universal (Shenzhen) Technology Co. LTD is designed to function as a branch office accessing high level ability to source products and build relationships with manufacturers in the region and as a lower cost form of support research and development as engineers are more plentiful in the region. In the future, this office could also handle other online marketing and marketing production activities, provided a cost and quality benefit exists at the time.
Intellectual Property Protection
On November 4, 2016, we filed a U.S. patent application number 15/344,041 with the USPTO. On March 5, 2018, we issued a press release announcing that the USPTO published an Issue Notification for U.S. Patent Application No. 9924295 entitled “Universal Smart Device,” which covers a patent application regarding the Company’s Universal Smart Device. The patent was issued on March 20, 2018.
Subsequent to our internal research and development efforts, we filed with the USPTO on June 2, 2017, a patent application regarding a process for improving the spectral response curve of a photo sensor. The small and cost-effective multicolor sensor and its related software protected by the potential patent we believe could achieve a spectral response that approximates an ideal photo response to measure optical measurement. The patent was issued on February 26, 2019.
On November 29, 2019, the Company filed an international utility patent application filed through the patent cooperation treaty as application PCT/US2019/63880. In April 2020, the Company was notified that it received a favorable international search report from the International Searching Authority regarding this patent application, which patents the Company’s PLC technology. The World International Property Organization report cited only three category “A” documents, indicating that the Company’s application met both the novelty and non-obviousness patentability requirements. Consequently, the Company is optimistic that the patent covering the claims for its PLC technology will be issued in due course and will allow the Company to implement strong protections on the PLC technology worldwide.
On May 19, 2021, we filed thirteen provisional patent applications with the USPTO that we had been researching and developing for years encompassing a broad spectrum of technology areas including sensor technology, wired and wireless communications, power line communications, computer security, software solutions, interconnected technological communications, smart home systems and methods for both home and hydroponic areas, dynamic password cipher, local file security, payment card security, infrared sensor, and a method and apparatus for high data rate transmission.
In the fourth quarter of 2021, we hired the law firm of Knobbe Martens, Olson & Bear, LLP to serve as outside intellectual property counsel for the Company. The firm is working on transferring the Company’s provisional patent applications to formal patent applications.
Competitors
There are several competitors we have identified in the wireless sensor node industry, including traditional instruments or devices manufacturers such as Hanna Instruments and Extech Instruments.
Hach developed and launched the SC1000 Multi-parameter Universal Controller, a probe module for connecting up to 32 digital sensors or analyzers. However, their products are not compatible with smart phones yet; and we believe their price point is still prohibitive to consumers.
Monnit Corporation offers a range of wireless and remote sensors. Many of Monnit’s products are web-based wireless sensors that usually are not portable because of their power consumption. Also, the sensors’ real-time updates are slow; and we believe security of the web-based sensor data acquisition also may be a concern. In addition to purchasing the device, consumers usually have to pay monthly fees for using web-based services.
We are not trying to compete with traditional instruments or device manufacturers because we utilize our Ubiquitor device in conjunction with our smartphone application, which we believe will be a completely different product category.
| 49 |
Market Potential
We believe that wireless universal smart technology will play a critical role for traditional instrument manufacturers, as it is too expensive and difficult to develop for medium or smaller companies. The cost factor is the first consideration when deciding whether a company wants to develop smart wireless technologies and implement them in their products or use them in their field testing. We also hope to play a role in academic laboratories, particularly with smaller academic laboratories who are sensitive to price.
Results of Operations
For the year ended December 31, 2021 compared to the year ended December 31, 2020
Revenue
Our consolidated gross revenue for the years ended December 31, 2021 and 2020 was $1,434,446 and $1,678,967, respectively, which included revenue from related parties of $29,084 and $26,449, respectively. Revenue for the year ended December 31, 2021 decreased $244,521 due to AVX Design & Integration Inc. being unable to generate more service work or develop a big project during the pandemic.
Cost and Operating Expenses
The major components of our cost and operating expenses for the years ended December 31, 2021 and 2020 are outlined in the table below:
| For the year ended December 31, 2021 | For the year ended December 31, 2020 | Increase (Decrease) $ | ||||||||||
| Cost of revenue, excluding depreciation & amortization | 1,136,315 | $ | 1,395,187 | $ | (258,872 | ) | ||||||
| Selling expense | 39,821 | 22,590 | 17,231 | |||||||||
| Compensation – officers and directors | 661,171 | 832,250 | (171,079 | ) | ||||||||
| Research and development | 220,469 | 256,636 | (36,167 | ) | ||||||||
| Professional fees | 1,030,159 | 607,010 | 423,149 | |||||||||
| General and administrative | 1,363,098 | 1,269,207 | 93,891 | |||||||||
| Total costs and operating expenses | $ | 4,451,033 | $ | 4,382,880 | $ | 68,153 | ||||||
Cost of revenue, excluding depreciation & amortization for the year ended December 31, 2021 was $1,136,315, compared to $1,395,187 for the year ended December 31, 2020. This decrease in cost of revenue was related to the decrease in revenues.
Selling expense for the year ended December 31, 2021 was $39,821, compared to $22,590 for the year ended December 31, 2020. Selling expense incurred was mainly from third party advertising fees. The increase of selling expense was due to an increase in advertising fees.
Compensation – officers and directors were $661,171 and $832,250 for the years ended December 31, 2021 and 2020, respectively. The decrease was due to decrease in directors’ stock-based compensation - options.
Research and development costs were $220,469 and $256,636 for the years ended December 31, 2021 and 2020, respectively. The decrease was due to a decrease in the supplies needed for the research and development. The decrease of research and development costs was due to the fact that we completed the development stage and our newly developed products entered the testing phase.
Professional fees were $1,030,159 during the year ended December 31, 2021 compared to $607,010 during the year ended December 31, 2020. The increase in professional fees mainly resulted from the uplist in 2021 compared to the prior period.
General and administrative expenses of $1,363,098 incurred during the year ended December 31, 2021 primarily consisted of salaries of $487,073, insurance expense of $359,372 and depreciation expense of $162,160. General and administrative expenses of $1,269,207 incurred during the year ended December 31, 2020 primarily consisted of salaries of $491,638, insurance expense of $210,949 and depreciation expense of $162,242. The increase was mainly due to increased insurance premiums because of the Company’s uplist to NASDAQ.
| 50 |
Net Losses
During the years ended December 31, 2021 and 2020, we incurred net losses of $3,220,977 and $2,537,113 respectively, due to the factors discussed above, gain on extinguishment of debt of $371,118, loss on change in fair value of warrant liability of $1,284,780, and gain on settlement of derivative liability of $550,406.
Liquidity and Capital Resources
Working Capital
| December 31, 2021 |
December 31, 2020 |
|||||||
| Current Assets | $ | 9,214,340 | $ | 1,007,630 | ||||
| Current Liabilities | (571,442 | ) | (527,559 | ) | ||||
| Working Capital | $ | 8,642,898 | $ | 480,071 | ||||
Cash Flows
The table below, for the periods indicated, provides selected cash flow information:
| For the year ended December 31, 2021 | For the year ended December 31, 2020 | |||||||
| Net cash used in operating activities | $ | (2,228,405 | ) | $ | (1,955,091 | ) | ||
| Net cash used in investing activities | (22,990 | ) | (1,314 | ) | ||||
| Net cash provided by financing activities | 10,346,778 | 346,860 | ||||||
| Effect of exchange rate | (43 | ) | - | |||||
| Net change in cash | $ | 8,095,340 | $ | (1,609,545 | ) | |||
Cash Flows from Operating Activities
Our net cash outflows from operating activities of $2,228,405 for the year ended December 31, 2021 was primarily the result of our net loss of $3,220,977 and changes in our operating assets and liabilities offset by the add-back of non-cash expenses. The change in operating assets and liabilities includes an increase in accounts receivable of $28,875, increase in accounts receivable – related party of $15,176, decrease in inventory of $21,229, increase in other receivable of $13,057, increase in prepaid expenses of $210,017, decrease in deposits of $66,767, increase in operating lease right-of-use asset of $333,140, decrease in accounts payable and accrued liabilities of $94,484, decrease in accounts payable – related party of $17,471, increase in other current liabilities of $17,299, decrease in customer deposit of $57,106, increase in lease liabilities of $328,846, and decrease in other liabilities of $17,135. Non-cash expense included add-backs of $42,116 in bad debt expense, $162,160 in depreciation expense, $1,284,780 in change in fair value of warrant liability, $48,000 in stock-based compensation, $429,856 in stock option compensation, reduction in inventory reserve of $1,622, gain on extinguishment of debt of $258,960 and gain on settlement of derivative liability of $550,406.
Our net cash outflows from operating activities of $1,955,091 for the year ended December 31, 2020 was primarily the result of our net loss of $2,537,113 and changes in our operating assets and liabilities offset by the add-back of non-cash expenses. The change in operating assets and liabilities includes an increase in accounts receivable of $75,125, decrease in inventory of $21,289, increase in prepaid expenses of $44,282, increase in deposits of $100,000, increase in accounts payable and accrued liabilities of $8,132, increase in accounts payable – related party of $17,471, decrease in other current liabilities of $12,238, decrease in interest payable – related party of $1,750, decrease in customer deposit of $70,294, and increase in other liabilities of $4,800. Non-cash expense included add-backs of $21,907 in bad debt expense, $162,242 in depreciation expense, $48,000 in stock-based compensation, $605,150 in stock option compensation, reduction in inventory reserve of $852 and a net of $2,428 in amortization of right-of-use assets.
We expect that cash flows from operating activities may fluctuate in future periods as a result of a number of factors, including fluctuations in our net revenues and operating results, utilization of new revenue streams, collection of accounts receivable, and timing of billings and payments.
| 51 |
Cash Flows from Investing Activities
For the year ended December 31, 2021 we had cash outflow from investing activities of $22,990 from the purchase of property and equipment. For the year ended December 31, 2020 we had cash outflow from investing activities of $1,314 from the purchase of property and equipment.
Cash Flows from Financing Activities
For the year ended December 31, 2021, cash inflows of $10,346,778 were due to proceeds of SBA loans of $267,297, repayment of SBA loans of $246,650, proceeds from bank loan of $1,500,000, repayment of the bank loan of $1,500,000, proceeds from issuance of shares of $10,326,131. For the year ended December 31, 2020 the Company paid off a promissory note, resulting in cash outflows of $50,000 and obtained loans from the SBA in the amount of $396,860.
Going Concern
In the long term, the continuation of the Company as a going concern is dependent upon the continued financial support from its shareholders, the ability of the Company to repay its debt obligations, to obtain necessary equity financing to continue operations, and the attainment of profitable operations. For the year ended December 31, 2021, the Company had a net loss of $3,220,977 and negative cash flow from operating activities of $2,228,405. The Company raised $10.3 million through an underwritten public offering in September 2021. With the January 1, 2021 beginning cash amount of $583,325 and underwritten public offering of $10.3 million, the Company will have enough cash to cover its projected annual cash burn rate of $1,967,074, which is a decrease from the previous year. This is a result of coming off of a year where the company completed an uplisting transaction causing a greater than normal amount of expenditure, especially within professional service fees. Overall, the Company has adequate cash for the Company to continue operation as a going concern throughout 2022 without any additional capital raise. As a result, the previous factors raising substantial doubt to continue as a going concern have been alleviated for the following year.
Off-Balance Sheet Arrangements
As of December 31, 2021, we did not have any off-balance-sheet arrangements, as defined in Item 303(a)(4)(ii) of Regulation SK.
Item 7A. QUANTITATIVE AND QUALITATIVE DISCLOSURES ABOUT MARKET RISK
We are a smaller reporting company as defined by Rule 12b-2 of the Securities Exchange Act of 1934 and are not required to provide the information under this item.
| 52 |
Item 8. FINANCIAL STATEMENTS AND SUPPLEMENTARY DATA
FOCUS UNIVERSAL INC. AND SUBSIDIARY
FOR THE YEARS ENDED DECEMBER 31, 2021 AND 2020
Index to the Financial Statements
| F-1 |
Report of Independent Registered Public Accounting Firm
To the shareholders and the board of directors of Focus Universal, Inc.
Opinion on the Financial Statements
We have audited the accompanying consolidated balance sheets of Focus Universal, Inc. (the “Company”) as of December 31, 2021 and 2020, the related statement of operations, stockholders’ equity, and cash flows for the years then ended, and the related notes (collectively referred to as the “financial statements”). In our opinion, the financial statements present fairly, in all material respects, the financial position of the Company as of December 31, 2021 and 2020, and the results of its operations and its cash flows for the years then ended, in conformity with accounting principles generally accepted in the United States.
Substantial Doubt about the Company’s Ability to Continue as a Going Concern
The accompanying financial statements have been prepared assuming that the Company will continue as a going concern. As discussed in Note 2 to the financial statements, the Company’s significant operating losses raise substantial doubt about its ability to continue as a going concern. The financial statements do not include any adjustments that might result from the outcome of this uncertainty.
Basis for Opinion
These financial statements are the responsibility of the Company’s management. Our responsibility is to express an opinion on the Company’s financial statements based on our audit. We are a public accounting firm registered with the Public Company Accounting Oversight Board (United States) (“PCAOB”) and are required to be independent with respect to the Company in accordance with the U.S. federal securities laws and the applicable rules and regulations of the Securities and Exchange Commission and the PCAOB.
We conducted our audit in accordance with the standards of the PCAOB. Those standards require that we plan and perform the audit to obtain reasonable assurance about whether the financial statements are free of material misstatement, whether due to error or fraud.
Our audit included performing procedures to assess the risks of material misstatement of the financial statements, whether due to error or fraud, and performing procedures that respond to those risks. Such procedures included examining, on a test basis, evidence regarding the amounts and disclosures in the financial statements. Our audit also included evaluating the accounting principles used and significant estimates made by management, as well as evaluating the overall presentation of the financial statements. We believe that our audit provides a reasonable basis for our opinion.
Critical Audit Matter
The critical audit matter communicated below is a matter arising from the current-period audit of the financial statements that was communicated or required to be communicated to the audit committee and that (1) relates to accounts or disclosures that are material to the financial statements and (2) involved our especially challenging, subjective, or complex judgments. The communication of critical audit matters does not alter in any way our opinion on the financial statements, taken as a whole, and we are not, by communicating the critical audit matter below, providing a separate opinion on the critical audit matter or on the accounts or disclosures to which it relates.
| F-2 |
Revenue recognition — identification of contractual terms in certain customer arrangements
As described in Note 2 to the consolidated financial statements, management applies FASB Topic 606, Revenue from Contacts with Customers (“ASC 606”) to recognize revenue. Management recognizes revenue upon transfer of control of promised goods or services to customers in an amount that reflects the consideration the Company expects to receive in exchange for those goods or services. The Company’s revenue is divided into two sources, with one source being from project construction which is recognized over time using the percentage-of-completion method under the cost approach. Management is required to estimate the percentage of completion when determining the amount and timing of revenue recognition.
The principal considerations for our determination that performing procedures over the percentage-of-completion method of recognition of revenue contracts and subsequent payment collections is a critical audit matter as there are more significant risks associated with the percentage-of completion recognition of this revenue. This in turn led to significant effort in performing our audit procedures which were designed to evaluate whether the contractual terms, the timing of revenue recognition were appropriately identified and determined by management and to evaluate the reasonableness of management’s estimates.
Our audit procedures included, among others, understanding of controls relating to management’s revenue recognition process, examining transaction related documents, confirming revenues and outstanding receivables at the balance sheet date with a sample of the project construction customers, and testing collections subsequent to the balance sheet date.
/s/ BF Borgers CPA PC
We have served as the Company’s auditor since 2017
March 8, 2022
| F-3 |
FOCUS UNIVERSAL INC.
CONSOLIDATED BALANCE SHEETS
| December 31, | December 31, | |||||||
| 2021 | 2020 | |||||||
| ASSETS | ||||||||
| Current Assets: | ||||||||
| Cash | $ | $ | ||||||
| Accounts receivable, net | ||||||||
| Accounts receivable – related party | ||||||||
| Inventories, net | ||||||||
| Other receivables | ||||||||
| Prepaid expenses | ||||||||
| Deposit - current portion | ||||||||
| Total Current Assets | ||||||||
| Property and equipment, net | ||||||||
| Operating lease right-of-use asset | ||||||||
| Deposits | ||||||||
| Total Assets | $ | $ | ||||||
| LIABILITIES AND STOCKHOLDERS' EQUITY | ||||||||
| Current Liabilities: | ||||||||
| Accounts payable and accrued liabilities | $ | $ | ||||||
| Accounts payable - related party | ||||||||
| Other current liabilities | ||||||||
| Customer deposit | ||||||||
| Loan, current portion | ||||||||
| Lease liability, current portion | ||||||||
| Total Current Liabilities | ||||||||
| Non-Current Liabilities: | ||||||||
| Lease liability, less current portion | ||||||||
| Loan, less current portion | ||||||||
| Other liability | ||||||||
| Total Non-Current Liabilities | ||||||||
| Total Liabilities | ||||||||
| Contingencies (Note 13) | ||||||||
| Stockholders' Equity: | ||||||||
| Common stock, par value $ per share, shares authorized; and shares issued and outstanding as of December 31, 2021 and 2020, respectively | ||||||||
| Additional paid-in capital | ||||||||
| Shares to be issued, common shares | ||||||||
| Accumulated deficit | ( | ) | ( | ) | ||||
| Accumulated other comprehensive loss | ( | ) | ||||||
| Total Stockholders' Equity | ||||||||
| Total Liabilities and Stockholders' Equity | $ | $ | ||||||
The accompanying notes are an integral part of these consolidated financial statements.
| F-4 |
FOCUS UNIVERSAL INC.
CONSOLIDATED STATEMENTS OF OPERATIONS
| Years ended December 31, | ||||||||
| 2021 | 2020 | |||||||
| Revenue | $ | $ | ||||||
| Revenue - related party | ||||||||
| Total Revenue | ||||||||
| Costs and Operating Expenses | ||||||||
| Cost of revenue, excluding depreciation & amortization | ||||||||
| Selling expense | ||||||||
| Compensation - officers and directors | ||||||||
| Research and development | ||||||||
| Professional fees | ||||||||
| General and administrative | ||||||||
| Total Cost and Operating Expense | ||||||||
| Loss from Operations | ( | ) | ( | ) | ||||
| Other Income (Expense): | ||||||||
| Interest income (expense), net | ( | ) | ( | ) | ||||
| Interest (expense) - related party | ( | ) | ||||||
| Gain on extinguishment of debt | ||||||||
| Change in fair value of warrant liability | ( | ) | ||||||
| Gain on settlement of derivative liability | ||||||||
| Other income | ||||||||
| Total other income (expense) | ( | ) | ||||||
| Loss before income taxes | ( | ) | ( | ) | ||||
| Income tax expense | ||||||||
| Net Loss | $ | ( | ) | $ | ( | ) | ||
| Other comprehensive items | ||||||||
| Foreign currency translation loss | ( | ) | ||||||
| Total comprehensive loss | $ | ( | ) | $ | ( | ) | ||
| Weight Average Number of Common Shares Outstanding: Basic and Diluted | ||||||||
| Net Loss per common share: Basic and Diluted | $ | ( | ) | $ | ( | ) | ||
The accompanying notes are an integral part of these consolidated financial statements.
| F-5 |
FOCUS UNIVERSAL INC.
CONSOLIDATED STATEMENTS OF CHANGES IN STOCKHOLDERS’ EQUITY
FOR THE YEARS ENDED DECEMBER 31, 2021 and 2020
| Shares to be | Accumulated | |||||||||||||||||||||||||||
| Common stock | Additional | issued | Other | Total | ||||||||||||||||||||||||
| Description | Shares | Amount | Paid-In Capital | Common Shares | Accumulated Deficit | Comprehensive Loss | Stockholders’ Equity | |||||||||||||||||||||
| Balance - December 31, 2019 | $ | $ | $ | $ | ( | ) | $ | $ | ||||||||||||||||||||
| Stock based compensation - options | – | |||||||||||||||||||||||||||
| Common stock to be issued for services | – | |||||||||||||||||||||||||||
| Net loss | – | ( | ) | ( | ) | |||||||||||||||||||||||
| Balance - December 31, 2020 | ( | ) | ||||||||||||||||||||||||||
| Issuance of common stock | ||||||||||||||||||||||||||||
| Stock based compensation - options | – | |||||||||||||||||||||||||||
| Common stock to be issued for services | – | |||||||||||||||||||||||||||
| Other comprehensive loss | – | ( | ) | ( | ) | |||||||||||||||||||||||
| Net loss | – | ( | ) | ( | ) | |||||||||||||||||||||||
| Balance - December 31, 2021 | ( | ) | ( | ) | ||||||||||||||||||||||||
The accompanying notes are an integral part of these consolidated financial statements
| F-6 |
FOCUS UNIVERSAL INC.
CONSOLIDATED STATEMENTS OF CASH FLOWS
| For the Years Ended December 31, | ||||||||
| 2021 | 2020 | |||||||
| Cash flows from operating activities: | ||||||||
| Net Loss | $ | ( | ) | $ | ( | ) | ||
| Adjustments to reconcile net loss to net cash from operating activities: | ||||||||
| Bad debt expense | ||||||||
| Inventories reserve | ( | ) | ( | ) | ||||
| Depreciation expense | ||||||||
| Gain on extinguishment of debt | ( | ) | ||||||
| Change in fair value of warrant liability | ||||||||
| Gain on settlement of derivative liability | ( | ) | ||||||
| Amortization of right-of-use assets | ( | ) | ||||||
| Stock-based compensation | ||||||||
| Stock based compensation - options | ||||||||
| Changes in operating assets and liabilities: | ||||||||
| Accounts receivable | ( | ) | ( | ) | ||||
| Accounts receivable - related party | ( | ) | ||||||
| Inventories | ||||||||
| Other receivable | ( | ) | ||||||
| Prepaid expenses | ( | ) | ( | ) | ||||
| Deposit | ( | ) | ||||||
| Operating lease right-of-use asset | ( | ) | ||||||
| Accounts payable and accrued liabilities | ||||||||
| Accounts payable - related party | ( | ) | ||||||
| Other current liabilities | ( | ) | ||||||
| Interest payable - related party | ( | ) | ||||||
| Customer deposit | ( | ) | ( | ) | ||||
| Lease liabilities | ||||||||
| Other liabilities | ( | ) | ||||||
| Net cash flows used in operating activities | ( | ) | ( | ) | ||||
| Cash flows from investing activities: | ||||||||
| Purchase of property and equipment | ( | ) | ( | ) | ||||
| Net cash flows used in investing activities | ( | ) | ( | ) | ||||
| Cash flows from financing activities: | ||||||||
| Proceeds from SBA loan | ||||||||
| Repayment on SBA loan | ( | ) | ||||||
| Repayment on promissory note | ( | ) | ||||||
| Proceeds from bank loan | ||||||||
| Repayment on bank loan | ( | ) | ||||||
| Proceeds from IPO, net | ||||||||
| Net cash flows provided by financing activities | ||||||||
| Effect of exchange rate | ( | ) | ||||||
| Net change in cash | ( | ) | ||||||
| Cash beginning of year | ||||||||
| Cash end of year | $ | $ | ||||||
| Supplemental cash flow disclosure: | ||||||||
| Cash paid for income taxes | $ | $ | ||||||
| Cash paid for interest | $ | $ | ||||||
| Supplemental disclosure of non-cash financing activities: | ||||||||
| Cashless warrant | $ | $ | ||||||
The accompanying notes are an integral part of these consolidated financial statements.
| F-7 |
FOCUS UNIVERSAL INC.
NOTES TO THE CONSOLIDATED FINANCIAL STATEMENTS
DECEMBER 31, 2021 AND 2020
Note 1 – Organization and Operations
Focus Universal Inc. (“Focus”) was incorporated under the laws of the State of Nevada on December 4, 2012 (“Inception”). It is a universal smart instrument developer and manufacturer, headquartered in the Ontario, California, specializing in the development and commercialization of novel and proprietary universal smart technologies and instruments. Universal smart technology is an off-the-shelf technology utilizing an innovative hardware integrated platform. The Focus platform provides a unique and universal combined wired and wireless solution for embedded design, industrial control, functionality test, and parameter measurement instruments and functions. The Company’s smart technology software utilizes a smartphone, computer, or a mobile device as an interface platform and display that communicates and works in tandem with a group of external sensors or probes, or both. The external sensors and probes may be manufactured by different vendors, but the universal smart technology functions in a manner that does not require the user to have extensive knowledge of the unique characteristics of the function of each of the sensors and probes. The universal smart instrument Focus developed (the “Ubiquitor”) consists of a reusable foundation component which includes a wireless gateway (which allows the instrument to connect to the smartphone via Bluetooth and WiFi technology), universal smart application software (“Application”) which is installed on the user’s smartphone or other mobile device and allows monitoring of the sensor readouts on the smartphone screen. The Ubiquitor also connects to a variety of individual scientific sensors that collect data, from moisture, light, airflow, voltage, and a wide variety of applications. The data then sent through a wired or wireless connection, or a combination thereof to the smartphone or other mobile device and the data is organized and displayed on the smartphone screen. The smartphone or other mobile device, foundation, and sensor readouts together perform the functions of many traditional scientific and engineering instruments and are intended to replace the traditional, wired stand-alone instruments at a fraction of their cost.
Perfecular Inc. (“Perfecular”), a wholly-owned subsidiary of Focus, was founded in September 2009 and is headquartered in Ontario, California, and is engaged in designing certain digital sensor products and sells a broad selection of horticultural sensors and filters in North America and Europe.
AVX Design & Integration, Inc. (“AVX”) was incorporated on June 16, 2000 in the state of California. AVX is an internet of things (“IoT”) installation and management company specializing in high performance and easy to use Audio/Video, Home Theater, Lighting Control, Automation and Integration. Services provided by AVX include full integration of houses, apartment, commercial complex, office spaces with audio, visual and control systems to fully integrate devices in the low voltage field. AVX’s services also include partial equipment upgrade and installation.
On December 23, 2021, Focus set up a branch in Shenzhen China, Focus Universal (Shenzhen) Technology Company LTD. The subsidiary was registered to be engaged in IoT research and development, equipment sales, and application services, software development and sales, software outsourcing, intelligent agricultural management, intelligent instrumentation sales, and information consulting services. This excludes any projects subject to approval or that require a separate business license in accordance with the local laws. China allows foreign entities to setup wholly owned limited liability companies in China, also known as Wholly Foreign Owned Enterprises (WFOEs), in non “restricted” or “prohibited” industries and business activities. The subsidiary’s business operation has been approved by the local government in Shenzhen to be qualified as a WFOE entity in China. The entity is 100% owned by Focus Universal, Inc.
Note 2 – Summary of Significant Accounting Policies
Basis of Presentation
The accompanying consolidated financial statements include the accounts of Focus and its wholly-owned subsidiaries, Perfecular Inc. and AVX Design & Integration, Inc. (collectively, the “Company”, “we”, “our”, or “us”). All intercompany balances and transactions have been eliminated upon consolidation. The Company’s consolidated financial statements have been prepared in accordance with accounting principles generally accepted in the United States of America (“U.S. GAAP”).
Going Concern
In the long term, the continuation of the Company
as a going concern is dependent upon the continued financial support from its shareholders, the ability of the Company to repay its debt
obligations, to obtain necessary equity financing to continue operations, and the attainment of profitable operations. For the year ended
December 31, 2021, the Company had a net loss of $
| F-8 |
Principles of Consolidation
The accompanying consolidated financial statements include the accounts of the Company and its wholly-owned subsidiaries, Perfecular Inc., AVX Design & Integration, and Focus Universal (Shenzhen) Technology Co. LTD. Focus and Perfecular, collectively “the entities,” were under common control; therefore, in accordance with Financial Accounting Standards Board (“FASB”) Accounting Standards Codification (“ASC”) 805-50-45, the acquisition of Perfecular was accounted for as a business combination between entities under common control and treated similar to a pooling of interest transaction. On March 15, 2019, Focus entered into a stock purchase agreement with AVX whereby Focus purchased 100% of the outstanding stock of AVX. On December 23, 2021, Focus established Focus Universal (Shenzhen) Technology Co. LTD as a wholly owned subsidiary. All significant intercompany transactions and balances have been eliminated.
Segment Reporting
The Company currently has two operating segments. In accordance with ASC 280, Segment Reporting (“ASC 280”), the Company considers operating segments to be components of the Company’s business for which separate financial information is available and evaluated regularly by Management in deciding how to allocate resources and to assess performance. Management reviews financial information presented on a consolidated basis for purposes of allocating resources and evaluating financial performance. Accordingly, the Company has determined that it has two operating and reportable segments.
Asset information by operating segment is not presented as the chief operating decision maker does not review this information by segment. The reporting segments follow the same accounting policies used in the preparation of the Company’s consolidated financial statements.
Use of Estimates
The preparation of consolidated financial statements in conformity with U.S. GAAP requires management to make estimates and assumptions that affect the reported amounts of assets and liabilities and the disclosure of contingent assets and liabilities as of the date of the accompanying consolidated financial statements, and the reported amounts of revenues and expenses during the reporting period. The Company bases its estimates and assumptions on current facts, historical experience and various other factors that it believes to be reasonable under the circumstances, the results of which form the basis for making judgments about the carrying values of assets and liabilities and the accrual of costs and expenses that are not readily apparent from other sources.
The actual results experienced by the Company may differ materially and adversely from the Company’s estimates. To the extent there are material differences between the estimates and the actual results, future results of operations will be affected. Significant estimates in the accompanying financial statements include the lease term impacting right-of use asset and lease liability, useful lives of property and equipment, useful lives of intangible assets, allowance for doubtful accounts, inventory reserves, debt discounts, valuation of derivatives, and the valuation allowance on deferred tax assets. The Company regularly evaluates its estimates and assumptions.
Cash
The Company considers all highly liquid investments
with a maturity of three months or less to be cash. At times, such investments may be in excess of Federal Deposit Insurance Corporation
(FDIC) insurance limit. As of December 31, 2021 and 2020, approximately $
Accounts Receivable
The Company grants credit to clients that sell the Company’s products or engage in construction service under credit terms that it believes are customary in the industry and do not require collateral to support customer receivables. The accounts receivable balances are generally collected within 30 to 90 days of the product sale.
Allowance for doubtful accounts
The Company estimates an allowance for doubtful
accounts based on historical collection trends and review of the current status of trade accounts receivable. It is reasonably possible
that the Company's estimate of the allowance for doubtful accounts will change. As of December 31, 2021 and 2020, allowance for doubtful
accounts amounted to $
| F-9 |
Concentrations of Credit Risk
Financial instruments that potentially subject the Company to concentrations of credit risk consist primarily of cash and cash equivalents. The Company limits its exposure to credit loss by investing its cash with high credit quality financial institutions.
Inventory
Inventory consists primarily of parts and finished
goods and is valued at the lower of the inventory’s cost or net realizable value under the first-in-first-out method. Management
compares the cost of inventory with its market value and an allowance is made to write down inventory to market value, if lower. Inventory
allowances are recorded for obsolete or slow-moving inventory based on assumptions about future demand and marketability of products,
the impact of new product introductions and specific identification of items, such as discontinued products. These estimates could vary
significantly from actual requirements, for example, if future economic conditions, customer inventory levels or competitive conditions
differ from expectations. The Company regularly reviews the value of inventory based on historical usage and estimated future usage. If
estimated realized value of our inventory is less than cost, we make provisions in order to reduce its carrying value to its estimated
market value. As of December 31, 2021 and 2020, inventory reserve amounted to $
Property and Equipment
Property and equipment are stated at cost. The cost and accumulated depreciation of assets sold or retired are removed from the respective accounts and any gain or loss is included in earnings. Maintenance and repairs are expensed currently. Major renewals and betterments are capitalized. Depreciation is computed using the straight-line method. Estimated useful lives are as follows:
| Fixed assets | Useful life |
| Furniture | |
| Equipment | |
| Warehouse | |
| Improvement | |
| Land | N/A |
Long-Lived Assets
The Company applies the provisions of FASB ASC
Topic 360, Property, Plant, and Equipment, which addresses financial accounting and reporting for the impairment or disposal of long-lived
assets. ASC 360 requires impairment losses to be recorded on long-lived assets used in operations when indicators of impairment are present
and the undiscounted cash flows estimated to be generated by those assets are less than the assets’ carrying amounts. In that event,
a loss is recognized based on the amount by which the carrying value exceeds the fair value of the long-lived assets. Loss on long-lived
assets to be disposed of is determined in a similar manner, except that fair values are reduced for the cost of disposal. Long-term assets
of the Company are reviewed when circumstances warrant as to whether their carrying value has become impaired. The Company considers assets
to be impaired if the carrying value exceeds the future projected cash flows from related operations. The Company also re-evaluates the
periods of amortization to determine whether subsequent events and circumstances warrant revised estimates of useful lives. Based on its
review at December 31, 2021 and 2020, the Company believes there was
The Company accounts for stock-based compensation to employees in conformity with the provisions of ASC Topic 718, Stock-Based Compensation. Stock-based compensation to employees consist of stock options, grants, and restricted shares that are recognized in the statement of operations based on their fair values at the date of grant.
The measurement of stock-based compensation is subject to periodic adjustments as the underlying equity instruments vest and is recognized as an expense over the period during which services are received.
| F-10 |
The Company calculates the fair value of option grants utilizing the Black-Scholes pricing model and estimates the fair value of the stock based upon the estimated fair value of the common stock. The amount of stock-based compensation recognized during a period is based on the value of the portion of the awards that are ultimately expected to vest.
The resulting stock-based compensation expense for both employee and non-employee awards is generally recognized on a straight- line basis over the requisite service period of the award.
Warrant
The Company accounts for warrants as either equity-classified or liability-classified instruments based on an assessment of the warrant’s specific terms and applicable authoritative guidance in FASB ASC 480, Distinguishing Liabilities from Equity (“ASC 480”) and ASC 815, Derivatives and Hedging (“ASC 815”). The assessment considers whether the warrants are freestanding financial instruments pursuant to ASC 480, meet the definition of a liability pursuant to ASC 480, and whether the warrants meet all of the requirements for equity classification under ASC 815, including whether the warrants are indexed to the Company’s own ordinary shares and whether the warrant holders could potentially require “net cash settlement” in a circumstance outside of the Company’s control, among other conditions for equity classification. This assessment, which requires the use of professional judgment, is conducted at the time of warrant issuance and as of each subsequent quarterly period end date while the warrants are outstanding.
For issued or modified warrants that meet all of the criteria for equity classification, the warrants are required to be recorded as a component of additional paid-in capital at the time of issuance. For issued or modified warrants that do not meet all the criteria for equity classification, the warrants are required to be recorded at their initial fair value on the date of issuance, and each balance sheet date thereafter. Changes in the estimated fair value of the warrants are recognized as a non-cash gain or loss on the statements of operations. The fair value of the warrants was estimated using a Black-Scholes pricing model (see Note 11).
Fair Value of Financial Instruments
The Company follows paragraph ASC 825-10-50-10 for disclosures about fair value of its financial instruments and paragraph ASC 820-10-35-37 (“Paragraph 820-10-35-37”) to measure the fair value of its financial instruments. Paragraph 820-10-35-37 establishes a framework for measuring fair value in accounting principles generally accepted in the United States of America (U.S. GAAP), and expands disclosures about fair value measurements.
To increase consistency and comparability in fair value measurements and related disclosures, Paragraph 820-10-35-37 establishes a fair value hierarchy which prioritizes the inputs to valuation techniques used to measure fair value into three (3) broad levels. The fair value hierarchy gives the highest priority to quoted prices (unadjusted) in active markets for identical assets or liabilities and the lowest priority to unobservable inputs. The three (3) levels of fair value hierarchy defined by Paragraph 820-10-35-37 are described below:
| ☐ | Level 1: Quoted market prices available in active markets for identical assets or liabilities as of the reporting date. |
| ☐ | Level 2: Pricing inputs other than quoted prices in active markets included in Level 1, which are either directly or indirectly observable as of the reporting date. |
| ☐ | Level 3: Pricing inputs that are generally unobservable inputs and not corroborated by market data. |
Financial assets are considered Level 2 when their fair values are determined using pricing models, discounted cash flow methodologies or similar techniques and at least one significant model assumption or input is unobservable, such as Boustead warrant (Note 11).
The carrying amount of the Company’s financial assets and liabilities, such as cash, accounts receivable, inventories, other receivable, prepaid expenses, deposit, accounts payable and accrued expenses, other current liabilities, customer deposit, approximate their fair value because of the short maturity of those instruments.
| F-11 |
Transactions involving related parties cannot be presumed to be carried out on an arm's-length basis, as the requisite conditions of competitive, free-market dealings may not exist. Representations about transactions with related parties, if made, shall not imply that the related party transactions were consummated on terms equivalent to those that prevail in arm's-length transactions unless such representations can be substantiated.
However, it is not practical to determine the fair value of advances from stockholders, if any, due to their related party nature.
Comprehensive Income (Loss)
Other comprehensive income (loss) refers to revenues, expenses, gains and losses that under generally accepted accounting principles are included in comprehensive income but are excluded from net income (loss) as these amounts are recorded directly as an adjustment to stockholders’ equity. The Company other comprehensive loss for the years ended December 31, 2021 and 2020 was comprised of foreign currency translation adjustments.
Revenue Recognition
On September 1, 2018, the Company adopted ASC 606 – Revenue from Contracts with Customers using the modified retrospective transition approach. The core principle of ASC 606 is that revenue should be recognized in a manner that depicts the transfer of promised goods or services to customers in an amount that reflects the consideration to which the entity expects to be entitled for exchange of those goods or services. The Company’s updated accounting policies and related disclosures are set forth below, including the disclosure for disaggregated revenue. The impact of adopting ASC 606 was not material to the Consolidated Financial Statements.
Revenue from the Company is recognized under Topic 606 in a manner that reasonably reflects the delivery of its services and products to customers in return for expected consideration and includes the following elements:
| ☐ | executed contracts with the Company’s customers that it believes are legally enforceable; |
| ☐ | identification of performance obligations in the respective contract; |
| ☐ | determination of the transaction price for each performance obligation in the respective contract; |
| ☐ | Allocation of the transaction price to each performance obligation; and |
| ☐ | recognition of revenue only when the Company satisfies each performance obligation. |
These five elements, as applied to each of the Company’s revenue category, is summarized below:
| ☐ | Product sales – revenue is recognized at the time of sale of equipment to the customer. |
| ☐ | Service sales – revenue is recognized based on the service been provided to the customer. |
Revenue from our project construction is recognized over time using the percentage-of-completion method under the cost approach. The percentage of completion is determined by estimating stage of work completed. Under this approach, recognized contract revenue equals the total estimated contract revenue multiplied by the percentage of completion. Our construction contracts are unit priced, and an account receivable is recorded for amounts invoiced based on actual units produced.
Cost of Revenue, excluding depreciation & amortization
Cost of revenue includes the cost of services, labor and product incurred to provide product sales, service sales and project sales.
Research and development
Research and development costs are expensed as incurred. Research and development costs primarily consist of efforts to refine existing product models and develop new product models.
| F-12 |
Related Parties
The Company follows ASC 850-10 for the identification of related parties and disclosure of related party transactions. Pursuant to ASC 850-10-20 the related parties include: a) affiliates of the Company; b) entities for which investments in their equity securities would be required, absent the election of the fair value option under the Fair Value Option Subsection of ASC 825–10–15, to be accounted for by the equity method by the investing entity; c) trusts for the benefit of employees, such as pension and profit-sharing trusts that are managed by or under the trusteeship of management; d) principal owners of the Company; e) management of the Company; f) other parties with which the Company may deal if one party controls or can significantly influence the management or operating policies of the other to an extent that one of the transacting parties might be prevented from fully pursuing its own separate interests; and g) other parties that can significantly influence the management or operating policies of the transacting parties or that have an ownership interest in one of the transacting parties and can significantly Influence the other to an extent that one or more of the transacting parties might be prevented from fully pursuing its own separate interests.
The consolidated financial statements shall include disclosures of material related party transactions, other than compensation arrangements, expense allowances, and other similar items in the ordinary course of business. However, disclosure of transactions that are eliminated in the preparation of consolidated financial statements is not required in those statements. The disclosures shall include: (a) the nature of the relationship(s) involved; (b) a description of the transactions, including transactions to which no amounts or nominal amounts were ascribed, for each of the periods for which income statements are presented, and such other information deemed necessary to an understanding of the effects of the transactions on the consolidated financial statements; (c) the dollar amounts of transactions for each of the periods for which income statements are presented and the effects of any change in the method of establishing the terms from that used in the preceding period; and (d) amounts due from or to related parties as of the date of each balance sheet presented and, if not otherwise apparent, the terms and manner of settlement.
Commitments and Contingencies
The Company follows ASC 450-20 to report accounting for contingencies. Certain conditions may exist as of the date the consolidated financial statements are issued, which may result in a loss to the Company but which will only be resolved when one or more future events occur or fail to occur. The Company assesses such contingent liabilities, and such assessment inherently involves an exercise of judgment. In assessing loss contingencies related to legal proceedings that are pending against the Company or unasserted claims that may result in such proceedings, the Company evaluates the perceived merits of any legal proceedings or unasserted claims as well as the perceived merits of the amount of relief sought or expected to be sought therein.
If the assessment of a contingency indicates that it is probable that a material loss has been incurred and the amount of the liability can be estimated, then the estimated liability would be accrued in the Company’s consolidated financial statements. If the assessment indicates that a potential material loss contingency is not probable but is reasonably possible, or is probable but cannot be estimated, then the nature of the contingent liability, and an estimate of the range of possible losses, if determinable and material, would be disclosed.
Loss contingencies considered remote are generally not disclosed unless they involve guarantees, in which case the guarantees would be disclosed. Management does not believe, based upon information available at this time that these matters will have a material adverse effect on the Company’s financial position, results of operations or cash flows. However, there is no assurance that such matters will not materially and adversely affect the Company’s business, financial position, and results of operations or cash flows.
Income Tax Provision
The Company accounts for income taxes in accordance with ASC Topic 740, Income Taxes. ASC 740 requires a company to use the asset and liability method of accounting for income taxes, whereby deferred tax assets are recognized for deductible temporary differences, and deferred tax liabilities are recognized for taxable temporary differences. Temporary differences are the differences between the reported amounts of assets and liabilities and their tax bases. Deferred tax assets are reduced by a valuation allowance when, in the opinion of management, the Company does not foresee generating taxable income in the near future and utilizing its deferred tax asset, therefore, it is more likely than not that some portion, or all of, the deferred tax assets will not be realized. Deferred tax assets and liabilities are adjusted for the effects of changes in tax laws and rates on the date of enactment.
| F-13 |
Under ASC 740, a tax position is recognized as a benefit only if it is “more likely than not” that the tax position would be sustained in a tax examination, with a tax examination being presumed to occur. The amount recognized is the largest amount of tax benefit that is greater than 50% likely of being realized on examination. For tax positions not meeting the “more likely than not” test, no tax benefit is recorded. The Company has no material uncertain tax positions for any of the reporting periods presented.
Income taxes are accounted for using the asset and liability method. Deferred income taxes are provided for temporary differences in recognizing certain income, expense and credit items for financial reporting purposes and tax reporting purposes. Such deferred income taxes primarily relate to the difference between the tax basis of assets and liabilities and their financial reporting amounts. Deferred tax assets and liabilities are measured by applying enacted statutory tax rates applicable to the future years in which deferred tax assets or liabilities are expected to be settled or realized. There was no material deferred tax asset or liabilities as of December 31, 2021 and 2020.
As of December 31, 2021 and 2020, the Company
did
Net income (loss) per share is computed pursuant to ASC 260-10-45. Basic net income (loss) per share (“EPS”) is computed by dividing net income (loss) by the weighted average number of shares outstanding during the period.
Diluted EPS is computed by dividing net income (loss) by the weighted average number of shares of stock and potentially outstanding shares of stock during the period to reflect the potential dilution that could occur from common shares issuable through contingent shares issuance arrangement, stock options or warrants.
Due to the net loss incurred by the Company, potentially dilutive instruments would be anti-dilutive. Accordingly, diluted loss per share is the same as basic loss for all periods presented. The following potentially dilutive shares were excluded from the shares used to calculate diluted earnings per share as their inclusion would be anti-dilutive.
| Year ended December 31, | 2021 | 2020 | ||||||
| Stock options | ||||||||
| Total | ||||||||
Subsequent Events
The Company follows the guidance in ASC 855-10-50 for the disclosure of subsequent events. The Company will evaluate subsequent events through the date when the financial statements were issued. Pursuant to ASU 2010-09, the Company as an SEC filer considers its financial statements issued when they are widely distributed to users, such as through filing them on EDGAR. As of January 5, 2022, the Company founded a wholly owned subsidiary named Lusher Bioscientific, Inc. Lusher Bioscientific was founded to market to the hydroponic and controlled agriculture market and to assist in the product development of product within this sector. As of the date of this filing, the Company has only founded the subsidiary and activities are in the introductory phase.
Reclassification
Certain reclassifications have been made to the consolidated financial statements for prior years to the current year’s presentation. Such reclassifications have no effect on net income as previously reported.
Foreign Currency Translation and Transactions
The reporting and functional currency of Focus is the USD. The functional currency of Focus Universal (Shenzhen) Technology Co. LTD, a wholly owned subsidiary of Focus located in China, is the Renminbi (“RMB”).
For financial reporting purposes, the financial statements of the Company’s Chinese subsidiary, which are prepared using the RMB, are translated into the Company’s reporting currency, USD. Assets and liabilities are translated using the exchange rate on the balance sheet date. Revenue and expenses are translated using average exchange rates prevailing during each reporting period. Stockholders’ equity is translated at historical exchange rates. Adjustments resulting from the translation are recorded as a separate component of accumulated other comprehensive loss in stockholders’ equity.
Transactions denominated in currencies other than the functional currency are translated into the functional currency at the exchange rates prevailing at the dates of the transactions. The resulting exchange difference, presented as foreign currency transaction loss, is included in the accompanying consolidated statements of operations.
| F-14 |
Note 3 – Recent Accounting Pronouncement
Recently Adopted Accounting Standards
In December 2019, Financial Accounting Standards Board (“FASB”) issued ASU 2019-12, Income Taxes, which provides for certain updates to reduce complexity in the accounting for income taxes, including the utilization of the incremental approach for intra-period tax allocation, among others. The amendments in ASU 2019-12 are effective for fiscal years, and interim periods within those fiscal years, beginning after December 15, 2020. The adoption of this ASU did not have a material effect on its condensed consolidated financial statements.
In January 2020, the FASB issued ASU 2020-01, Investments-Equity Securities (Topic 321), Investments-Equity Method and Joint Ventures (Topic 323), and Derivatives and Hedging (Topic 815)-Clarifying the Interactions between Topic 321, Topic 323, and Topic 815. The guidance provides clarification of the interaction of rules for equity securities, the equity method of accounting and forward contracts and purchase options on certain types of securities. ASU 2020-01 is effective for the Company in the first quarter of 2021. The adoption did not have any significant impact on the Company’s condensed consolidated financial statements.
In June 2020, the FASB issued ASU 2020-05 in response to the ongoing impacts to U.S. businesses in response to the COVID-19 pandemic. ASU 2020-05, Revenue from Contracts with Customers (Topic 606) and Leases (Topic 842) Effective Dates for Certain Entities provide a limited deferral of the effective dates for implementing previously issued ASU 606 and ASU 842 to give some relief to businesses considering the difficulties they are facing during the pandemic. These entities may defer application to fiscal years beginning after December 15, 2019, and interim periods within fiscal years beginning after December 15, 2020. As the Company has already adopted ASU 606 and ASU 842, the Company does not anticipate any effect on its financial statements.
Recently Issued Accounting Standards Not Yet Adopted
In June 2016, the FASB issued ASU No. 2016-13, (Topic 326), Financial Instruments – Credit Losses: Measurement of Credit Losses on Financial Instruments which amends the current accounting guidance and requires the use of the new forward-looking “expected loss” model, rather than the “incurred loss” model, which requires all expected losses to be determined based on historical experience, current conditions and reasonable and supportable forecasts. This guidance amends the accounting for credit losses for most financial assets and certain other instruments including trade and other receivables, held-to-maturity debt securities, loans and other instruments. In November 2019, the FASB issued ASU No. 2019-10 to postpone the effective date of ASU No. 2016-13 for public business entities eligible to be smaller reporting companies defined by the SEC to fiscal years beginning after December 15, 2022, including interim periods within those fiscal years. The Company believes the adoption of ASU No. 2016-13 will not have a material impact on its financial position and results of operations.
In August 2020, the FASB issued ASU 2020-06, Debt – Debt with Conversion and Other Options (Subtopic 470-20) and Derivatives and Hedging-Contracts in Entity’s Own Equity (Subtopic 815-40): Accounting for Convertible Instruments and Contracts in an Entity’s Own Equity, to improve financial reporting associated with accounting for convertible instruments and contracts in an entity’s own equity. ASU 2020-06 will be effective for the Company in the first quarter of 2022. The Company is currently evaluating the amended guidance and the impact on its consolidated financial statements and related disclosures.
Management does not believe that any recently issued, but not yet effective, accounting standards could have a material effect on the accompanying financial statements. As new accounting pronouncements are issued, we will adopt those that are applicable under the circumstances.
Note 4 – Inventory, net
At December 31, 2021 and 2020, inventory consisted of the following:
| December 31, 2021 | December 31, 2020 | |||||||
| Parts | $ | $ | ||||||
| Finished goods | ||||||||
| Total | ||||||||
| Less inventory reserve | ( | ) | ( | ) | ||||
| Inventory, net | $ | $ | ||||||
| F-15 |
Note 5 – Deposits
Deposit balance as of December 31, 2021 amounted
to $
Note 6 – Property and Equipment
At December 31, 2021 and 2020, property and equipment consisted of the following:
| December 31, 2021 | December 31, 2020 | |||||||
| Warehouse | $ | $ | ||||||
| Land | ||||||||
| Building improvement | ||||||||
| Furniture and fixture | ||||||||
| Equipment | ||||||||
| Software | ||||||||
| Total cost | ||||||||
| Less accumulated depreciation | ( | ) | ( | ) | ||||
| Property and equipment, net | $ | $ | ||||||
Depreciation expense for the years ended December
31, 2021 and 2020 amounted to $
The Company purchased a warehouse in Ontario,
California in September 2018 and leased an unused portion to a third party. The tenant paid $
Note 7 – Related Party Transactions
Revenue generated from Vitashower Corp., a company
owned by the CEO’s wife, amounted to $
Compensation for services provided by the President
and Chief Executive Officer for the years ended December 31, 2021 and 2020 amounted to $
Note 8 – Business Concentration and Risks
Major customers
One customer accounted for
Major vendors
One vendor, Tianjin Guanglee, accounted for
| F-16 |
Note 9 – Lease
The Company recorded its operating lease cost
of $
On April 8, 2015, AVX Design & Integration Inc. entered an eighty-six month commercial lease with a third party for an approximately 2,592 square foot office space. The lease commenced on July 1, 2015 and will end on August 31, 2022. The monthly rent is $4,536 with approximately a 3% increase rate in each additional year. The incremental borrowing rate for a lease is the rate of interest the Company would have to pay on a collateralized basis to borrow an amount equal to the lease payments for the asset under similar term, which is 15%. Lease expense for the lease is recognized on a straight-line basis over the lease term.
On December 7, 2021, Focus Universal (Shenzhen) Technology Co. LTD entered a thirty-eight month commercial lease with a third party for an approximately 5,895 square foot office space. The lease commenced on December 25, 2021 and will end on February 28, 2025. The monthly rent is RMB70,097 (approximately $11,014) with approximately an 11.1% to 12.5% increase rate in each additional year. The incremental borrowing rate for a lease is the rate of interest the Company would have to pay on a collateralized basis to borrow an amount equal to the lease payments for the asset under similar term, which is 10%. Lease expense for the lease is recognized on a straight-line basis over the lease term.
Operating lease right-of-use assets represent the Company’s right to use an underlying asset for the lease term and lease liabilities represent the Company’s obligation to make lease payments arising from the lease. As of December 31, 2021 and 2020, operating lease right-of use assets and lease liabilities were as follows:
| December 31, 2021 | December 31, 2020 | |||||||
| Operating lease right-of-use assets | $ | $ | ||||||
| Lease liabilities, current portion | $ | $ | ||||||
| Lease liabilities, less current portion | $ | $ | ||||||
Lease term and discount rate:
| December 31, 2021 | December 31, 2020 | |||
| Weighted average remaining lease term | ||||
| Operating lease | ||||
| Weighted average discount rate | ||||
| Operating lease |
The minimum future lease payments are as follows:
| Amount | ||||
| Year ending December 31, 2022 | $ | |||
| Year ending December 31, 2023 | ||||
| Year ending December 31, 2024 | ||||
| Year ending December 31, 2025 | ||||
| Total minimum lease payment | ||||
| Less: imputed interest | ( | ) | ||
| Present value of future minimum lease payments | $ | |||
Note 10 – Loans
Paycheck Protection Program
On April 24, 2020, AVX Design & Integration,
Inc. entered into an agreement to receive a U.S. Small Business Administration Loan (“SBA Loan”) from JPMorgan Chase Bank,
N.A. related to the COVID-19 pandemic in the amount of $
| F-17 |
On May 4, 2020, Perfecular Inc. entered into an
agreement to receive a U.S. Small Business Administration Loan (“SBA Loan”) from Bank of America related to the COVID-19 pandemic
in the amount of $
On March 2, 2021, Perfecular Inc. entered into
an agreement to receive a U.S. Small Business Administration Loan (“SBA Loan”) from Wells Fargo related to the COVID-19 pandemic
in the amount of $
On March 10, 2021, AVX Design & Integration,
Inc. entered into an agreement to receive an SBA Loan from Chase Bank related to the COVID-19 pandemic in the amount of $
Economic Injury Disaster Loan
On June 4, 2020, Perfecular Inc. entered into
an agreement to receive a U.S. Small Business Administration Loan (“SBA Loan”) from Bank of America related to the COVID-19
pandemic in the amount of $
On June 5, 2020, AVX Design & Integration,
Inc. entered into an agreement to receive a U.S. Small Business Administration Loan (“SBA Loan”) from JPMorgan Chase Bank,
N.A. related to the COVID-19 pandemic in the amount of $
Bank Loan
On January 8, 2021, Focus Universal Inc. entered
into a secured promissory note agreement with East West Bank in the amount of $
| December 31, 2021 | December 31, 2020 | |||||||
| SBA Loan | $ | $ | ||||||
| Less: current portion | ( | ) | ( | ) | ||||
| Long term portion | $ | $ | ||||||
Interest expense incurred from the loans amounted
to $
| F-18 |
Note 11 – Stockholders’ Equity
Shares authorized
Upon formation, the total number of shares of all classes of stock that the Company is authorized to issue is seventy-five million () shares of common stock, par value $ per share.
Common stock
During the year ended December 31, 2021, the Company issued shares of common stock.
On September 2, 2021, the Company closed its initial public offering (“IPO”) under a registration statement effective August 30, 2021, in which it issued and sold shares of its Common Stock at a purchase price of $ per share. On September 2, 2021, the Company closed on the IPO’s overallotment option, selling an additional shares of Common Stock to the IPO’s underwriters at the public offering price of $ per share. The Company received net proceeds of approximately $ million from the IPO after deducting underwriting fee and offering expenses.
As of December 31, 2021 and 2020, the Company had and shares of common stock issued and outstanding, respectively.
Shares to be issued for compensation
The Company entered into agreements with third
party consultants for financing and management consulting. The Company has incurred consulting service fees not paid in cash amounting
to $
On August 30, 2021, the Company entered into a
Representative Common Stock Purchase Warrant agreement (“Warrant Agreement”) with its placement agent, Boustead Securities
LLC. (“Boustead”) for 161,000 shares and the exercise price is $6.25. Boustead exercised the warrants on September 7, 2021.
The fair value of the warrants was $
These warrants were valued using a Black-Scholes pricing model with the following assumptions:
| August 30, 2021 (Initial | September 7, | |||||||
| Measurement) | 2021 | |||||||
| Risk-free interest rate | % | % | ||||||
| Expected term | years | years | ||||||
| Expected volatility | % | % | ||||||
| Expected dividend yield | % | % | ||||||
| Fair value of units (using Black-Scholes) | $ | $ | ||||||
This Warrant Agreement allowed for cashless exercise option, which is calculated by the percentage difference between exercise and trading price, which resulted in a reduced number of warrants being exercisable. On September 7, 2021, Boustead exercised 121,149 warrants with fair value of $1,776,044 upon cashless exercise option of warrants related to completion of the Company’s public offering. The shares will be issued six months after these warrants have been exercised. For the year ended December 31, 2021, the Company has a gain on settlement of derivative liability which amounted to $550,406. Shares to be issued as of December 31, 2021 and December 31, 2020 amounted to $1,776,044 and $0, respectively.
| F-19 |
Stock options
On August 6, 2019, each member of the Board was
granted
On January 4, 2021, each member of the Board was
granted
On December 31, 2021, each member of the Board
was granted
As of December 31, 2021, there were
For the years ended December 31, 2021 and 2020, the Company’s stock option compensation expenses amounted to $ and $, respectively.
The fair value of the stock options listed above was determined using the Black-Scholes option pricing model with the following assumptions:
| December 31, 2021 | December 31, 2020 | |||||||
| Risk-free interest rate | – % | % | ||||||
| Expected life of the options | years | years | ||||||
| Expected volatility | – % | % | ||||||
| Expected dividend yield | % | % | ||||||
The following is a summary of options activity from December 31, 2020 to December 31, 2021:
| Options | Shares | Weighted average exercise price | Weighted Average Remaining Contractual Life | Aggregate Intrinsic Value | ||||||||||||
| Outstanding at December 31, 2020 | $ | – | ||||||||||||||
| Granted | $ | – | – | |||||||||||||
| Exercised | $ | – | – | |||||||||||||
| Forfeited or expired | $ | – | – | |||||||||||||
| Outstanding at December 31, 2021 | $ | |||||||||||||||
| Vested as of December 31, 2021 | $ | |||||||||||||||
| Exercisable at December 31, 2021 | $ | |||||||||||||||
As of December 31, 2021, there were options with an exercise price of $, options with an exercise price of $, and options with an exercise price of $ outstanding. As of December 31, 2021, there were options with an exercise price of $5.70, options with an exercise price of $3.00, and options with an exercise price of $8.86 exercisable.
| F-20 |
Note 12 – Segment reporting
The Company consists of two types of operations. Focus Universal, Inc. and Perfecular Inc. (“Focus”) involve wholesale, research and development of universal smart instrument and farming devices. AVX Design & Integration, Inc. (“AVX”) is an IoT installation and management company specializing in high performance and easy to use audio/video, home theater, lighting control, automation, and integration. The table below discloses income statement information by segment.
| Year ended December 31, 2021 | ||||||||||||
| Focus | AVX | Total | ||||||||||
| Revenue | $ | $ | $ | |||||||||
| Revenue - related party | ||||||||||||
| Total revenue | ||||||||||||
| Cost and Operating Expenses | ||||||||||||
| Cost of Revenue, excluding depreciation & amortization | ||||||||||||
| Selling expense | ||||||||||||
| Compensation - officers and directors | ||||||||||||
| Research and development | ||||||||||||
| Professional fees | ||||||||||||
| General and administrative | ||||||||||||
| Total Cost and Operating Expenses | ||||||||||||
| Loss from Operations | ( | ) | ( | ) | ( | ) | ||||||
| Other Income (Expense): | ||||||||||||
| Interest income (expense), net | ( | ) | ( | ) | ( | ) | ||||||
| Gain on extinguishment of debt | ||||||||||||
| Change in fair value of warrant liability | ( | ) | ( | ) | ||||||||
| Gain on settlement of derivative liability | ||||||||||||
| Other income (expense), net | ( | ) | ||||||||||
| Total other income (expense) | ( | ) | ( | ) | ||||||||
| Loss before income taxes | ( | ) | ( | ) | ( | ) | ||||||
| Tax expense | ||||||||||||
| Net Loss | $ | ( | ) | $ | ( | ) | $ | ( | ) | |||
Note 13 – Commitments and Contingencies
Pending Litigation
In the normal course of business or otherwise, the Company may become involved in legal proceedings. The Company will accrue a liability for such matters when it is probable that a liability has been incurred and the amount can be reasonable estimated. When only a range of possible loss can be established, the most probable amount in the range is accrued. The accrual for a litigation loss contingency might include, for example, estimates of potential damages, outside legal fees, and other directly related costs expected to be incurred.
| F-21 |
Employment Agreements
In November 2021, the Company entered into a one-year employment agreement with VP of Finance and Head of Investor Relations of the Company, pursuant to which the Company rewards bonus management shares will be granted in blocks every quarter if any of the below three performances metrics are met during the employment term:
| 1. | 90 Day Volume Weighted Average Stock Price: Increase 20% over previous quarter | |
| 2. | Avg 90 trading volume: Increase 15% over previous quarter | |
| 3. | Number of Stocktwits watchers: Increase 100% per quarter |
During the year ended December 31, 2021 and 2020, The Company recognized employee compensation amount of $ and $, respectively.
Note 14 – Income taxes
The United States of America
The Company is subject to taxation in the United
States and certain state jurisdictions. The provision for income taxes differs from the amounts which would be provided by applying the
statutory federal income tax rate of
People’s Republic of China
Effective January 1, 2008, the New Taxation Law
of PRC stipulates that domestic enterprises and foreign invested enterprises (the “FIEs”) are subject to a uniform tax rate
of
Our effective tax rate differs from the statutory federal income tax rate, primarily as a result of the changes in valuation allowance, nondeductible permanent differences, credits, and state income taxes.
A reconciliation of the federal statutory income tax to our effective income tax is as follows:
| 2021 | 2020 | |||||||
| Federal statutory rates | $ | ( | ) | $ | ( | ) | ||
| State income taxes | ( | ) | ( | ) | ||||
| Foreign income taxes | ( | ) | ||||||
| Permanent differences | ( | ) | ||||||
| Valuation allowance against net deferred tax assets | ||||||||
| Effective rate | $ | $ | ||||||
The tax effect of temporary differences that give rise to a significant portion of the deferred tax assets and liabilities at December 31, 2021 and 2020 is presented below:
| 2021 | 2020 | |||||||
| Deferred income tax asset | ||||||||
| Net operating loss carryforwards | $ | $ | ||||||
| Interest | ||||||||
| Total deferred income tax asset | ||||||||
| Less: valuation allowance | ( | ) | ( | ) | ||||
| Total deferred income tax asset | $ | $ | ||||||
| F-22 |
The Company recognizes valuation allowances to
reduce deferred tax assets to the amount that is more likely than not to be realized. The Company’s net deferred income tax asset
is not more likely than not to be realized due to the lack of sufficient sources of future taxable income and cumulative losses that have
resulted over the years. During the year ended December 31, 2021 the valuation allowance increased by $
As of December 31, 2021, we had cumulative net
operating loss carryforwards for federal and state income tax purposes of $
Note 15 –Subsequent Events
As of January 5, 2022, the Company founded a wholly owned subsidiary named Lusher Bioscientific, Inc. Lusher Bioscientific was founded to market to the hydroponic and controlled agriculture market and to assist in the product development of product within this sector. As of the date of this filing, the Company has only founded the subsidiary and activities are in the introductory phase.
| F-23 |
Item 9. CHANGES IN AND DISAGREEMENTS WITH ACCOUNTANTS ON ACCOUNTING AND FINANCIAL DISCLOSURE
None.
Item 9A. CONTROLS AND PROCEDURES
Evaluation of Disclosure Controls
Our Chief Executive Officer and Principal Financial Officer, after evaluating the effectiveness of our “disclosure controls and procedures” (as defined in the Securities Exchange Act of 1934 Rules 13a-15(e) and 15d-15(e)) as of the end of the period covered by this Annual Report on Form 10-K (the “Evaluation Date”), concluded that as of the Evaluation Date, our disclosure controls and procedures were not effective to provide reasonable assurance that information we are required to disclose in reports that we file or submit under the Exchange Act is recorded, processed, summarized and reported within the time periods specified in the Securities and Exchange Commission rules and forms.
Changes in internal control over financial reporting.
There were no changes in our internal control over financial reporting during our most recent fiscal quarter that materially affected, or were reasonably likely to materially affect, our internal control over financial reporting.
Limitations on the Effectiveness of Internal Controls
Disclosure controls and procedures, no matter how well designed and implemented, can provide only reasonable assurance of achieving an entity’s disclosure objectives. The likelihood of achieving such objectives is affected by limitations inherent in disclosure controls and procedures. These include the fact that human judgment in decision-making can be faulty and that breakdowns in internal control can occur because of human failures such as simple errors or mistakes or intentional circumvention of the established process.
Management’s Report on Internal Control over Financial Reporting
Our management is responsible for establishing and maintaining adequate internal control over financial reporting, as such term is defined in the Securities Exchange Act of 1934 Rule 13a-15(f). Our management conducted an evaluation of the effectiveness of our internal control over financial reporting based on the framework in Internal Control - Integrated Framework, issued by the Committee of Sponsoring Organizations of the Treadway Commission (the “COSO Framework”). Our internal control over financial reporting is a process designed to provide reasonable assurance regarding the reliability of our financial reporting and the preparation of our financial statements for external purposes in accordance with U.S. GAAP.
A material weakness is a deficiency or combination of deficiencies, in internal control over financial reporting, such that there is a reasonable possibility that a material misstatement of our annual or interim financial statements will not be prevented or detected on a timely basis. An effective internal control system, no matter how well designed, has inherent limitations, including the possibility of human error or overriding of controls, and therefore can provide only reasonable assurance with respect to reliable financial reporting. Because of its inherent limitations, our internal control over financial reporting may not prevent or detect all misstatements, including the possibility of human error, the circumvention or overriding of controls or fraud. Effective internal controls can provide only reasonable assurance with respect to the preparation and fair presentation of financial statements.
In connection with the audit of our financial statements as of and for the years ended December 31, 2021 and 2020, we identified significant deficiencies in our internal control over financial reporting and a general understanding of U.S. GAAP. As such, there is a reasonable possibility that a misstatement of our financial statements will not be prevented or detected on a timely basis.
As we have thus far not needed to comply with Section 404 of the Sarbanes-Oxley Act, neither we nor our independent registered public accounting firm has performed an evaluation of our internal control over financial reporting in accordance with Section 404 of the Sarbanes-Oxley Act. In light of this deficiency, we believe that it is possible that certain control deficiencies and material weaknesses may have been identified if such an evaluation had been performed.
| 53 |
We are working to remediate the deficiencies and material weaknesses. Our remediation efforts are ongoing, and we will continue our initiatives to implement and document policies, procedures, and internal controls. We have taken steps to enhance our internal control environment and plan to take additional steps to remediate the deficiencies and address material weaknesses. Specifically:
| · | We have hired our Vice President of Finance. We have also hired additional outside consultants, and we will hire qualified personnel in our accounting department, especially to add an experienced accountant in a controller capacity. We will continue to evaluate the structure of the finance organization and add resources as needed; |
| · | We are engaging an external accounting firm to supplement our efforts to the implementation of the COSO Framework for internal controls; |
| · | We will design and implement internal controls related to revenue and expenses recognition accounting; |
| · | We are initiating a comprehensive program and development plan to provide ongoing company-wide trainings regarding internal controls, with particular emphasis on the training of our accounting staff; |
| · | We are implementing additional internal reporting procedures, including those designed to add depth to our review processes and improve our segregation of duties; |
| · | We are updating our systems so that we may collect the information necessary to enable us to more effectively monitor and comply with applicable filing requirements on a timely basis; |
| · | We will continue to enhance risk assessment procedures and conduct a comprehensive risk assessment to enhance overall compliance; and |
| · | We are redesigning and implementing common internal control activities; and we will continue to establish policies and procedures and enhance corporate oversight over process-level controls and structures to ensure that there is appropriate assignment of authority, responsibility and accountability to enable remediating our material weaknesses. |
In addition to the items noted above, as we continue to evaluate, remediate and improve our internal control over financial reporting, executive management may elect to implement additional measures to address control deficiencies or may determine that the remediation efforts described above require modification. Executive management, in consultation with and at the direction of our Audit Committee, will continue to assess the control environment and the above-mentioned efforts to remediate the underlying causes of the identified material weaknesses.
Although we plan to complete this remediation process as quickly as possible, we are unable, at this time to estimate how long it will take; and our efforts may not be successful in remediating the deficiencies or material weaknesses.
This annual report does not include an attestation report of the Company’s independent registered public accounting firm regarding internal control over financial reporting. Management’s report was not subject to attestation by the Company’s independent registered public accounting firm pursuant to rules of the SEC that permit the company to provide only management’s report on internal control in this annual report.
Item 9B. OTHER INFORMATION
None.
Item 9C. DISCLOSURE REGARDING FOREIGN JURISDICTIONS THAT PREVENT INSPECTIONS
Not applicable.
| 54 |
PART III
Item 10. DIRECTORS, EXECUTIVE OFFICERS AND CORPORATE GOVERNANCE
The following table presents information with respect to our officers, directors and significant employees as of the date of this report:
| Name | Position |
| Dr. Edward Lee* | Director and Chairman |
| Dr. Desheng Wang** | Chief Executive Officer, Secretary, and Director |
| Duncan Lee*** | Chief Financial Officer |
| Dr. Jennifer Gu* | Director |
| Michael Pope**** | Director (1) |
| Sheri Lofgren**** | Director (1) |
| Carine Clark**** | Director (1) |
| Greg Butterfield***** | Director (1) |
* Appointed director on October 21, 2015
** Appointed director on December 29, 2014
*** Appointed officer on April 2, 2018
**** Appointed director on June 8, 2018
***** Appointed director on November 28, 2018
(1) Independent director
Each director serves until our next annual meeting of the stockholders or unless they resign earlier and serves until his or her successor is elected and qualified. At the present time, members of the Board of Directors are not compensated with cash for their services to the board.
Each of our officers is elected by the Board of Directors to a term of one (1) year and serves until his or her successor is duly elected and qualified, or until he or she is removed from office.
Biographical Information Regarding Officers and Directors
Desheng Wang
Dr. Desheng Wang was appointed as Chief Executive Officer, Secretary, and has been a director since December 29, 2014. Dr. Wang has over 20 years of professional experience in mobile technology. Dr. Wang earned his bachelor’s degree from Hebei Normal University, Physics Department in 1985. In 1988, Dr. Wang earned his master’s degree from Dalian Institute of Chemical Physics at the Chinese Academy of Science. Dr. Wang earned his Ph.D. in Chemistry at Emory University in 1994. Dr. Wang served as a senior research fellow at California Institute of Technology from 1994-2011. Over the last five years, Dr. Wang has served as president of Vitashower Corporation and formerly as President of Perfecular Inc.
Edward Lee
Dr. Edward Lee was appointed President and director on October 21, 2015. On November 15, 2019, Dr. Lee resigned as President and was appointed as Chairman of the Board of Directors. Dr. Lee received his bachelor’s degree in Mathematics at Lanzhou University in 1983, received his master’s degree at University of Science and Technology of China in 1985 and earned his Ph.D. in Mathematics at University of Florida in 1991. Dr. Lee worked as an assistant professor at Tsinghua University in 1986 and National University of Singapore in 1992. Since 1996, Dr. Lee has served as CEO of AIDP, a leading supplier of dietary supplement ingredients, focusing on research and development and marketing and sales of proprietary ingredients like Magtein, KoACT, Predtic X, and Actizin. Dr. Lee is also serving as the Vice Chairperson of the American Chinese CEO Association. Dr. Lee is married to Jennifer Gu, a current director of Focus Universal.
| 55 |
Duncan Lee
Duncan Lee was appointed as CFO on April 2, 2018. Mr. Lee is presently a licensed Certified Public Accountant. Mr. Lee graduated in 2006 with a bachelor’s degree in Accounting from the University of Southern California and has more than 11 years of experience with public company accounting and financial reporting with the SEC. Mr. Lee worked on the audit staff of the PCAOB accounting firm of Moore Stephens Wurth Frazer and Torbet LLP and then worked as a senior associate at the PCAOB accounting firm of Simon & Edward, LLP in Diamond Bar, CA. Since 2011, Mr. Lee has worked in-house as a staff accountant at a public company called E-World USA Holding, Inc. preparing their routine securities filings, including their 10-K and 10-Q filings. In addition to working with E-World USA Holding, Inc., in the past five years, Mr. Lee has also worked as an outside consultant CPA for other public companies.
Jennifer Gu
Dr. Jennifer Gu was appointed as a director on October 21, 2015. Dr. Gu earned her bachelor’s degree in Biology from University of Florida in 1990 and earned her Ph.D. in Experimental Pathology at University of California, Los Angeles in 1997. She also completed post-doctoral research at the California Institute of Technology in 2004. Since 2005, Dr. Gu served, and is still currently serving, as the Vice President of Research & Development at AIDP. Dr. Gu is married to Edward Lee, the current Chairman of the Board of Directors of Focus Universal.
Michael Pope
Michael Pope was appointed as a director of the Company on June 8, 2018. Mr. Pope serves as the CEO and Chairman at Boxlight Corporation (Nasdaq: BOXL), a global provider of interactive technology solutions, where he has been an executive since July 2015 and director since September 2014. Mr. Pope has led Boxlight through nine acquisitions from 2016 to 2020, a Nasdaq IPO in November 2017, and over $100 million in debt and equity fundraising. He previously served as Managing Director at Vert Capital, a private equity and advisory firm from October 2011 to October 2016, managing portfolio holdings in the education, consumer products, technology and digital media sectors. Prior to joining Vert Capital, from May 2008 to October 2011, Mr. Pope was Chief Financial Officer and Chief Operating Officer for the Taylor Family in Salt Lake City, managing family investment holdings in consumer products, professional services, real estate and education. Mr. Pope also held positions including senior SEC reporting at Omniture (previously listed on Nasdaq and acquired by Adobe (Nasdaq: ADBE) in 2009) and Assurance Associate at Grant Thornton. Since January 2021, Mr. Pope has served as a member of the board of directors of Novo Integrated Sciences, Inc. (OTCQB: NVOS), a provider of multi-dimensional primary healthcare products and services. He holds an active CPA license and earned his undergraduate and graduate degrees in accounting from Brigham Young University.
Sheri Lofgren
Sheri Lofgren was appointed as an independent director of the Company on June 8, 2018. Ms. Lofgren has served as a financial consultant since March 2018. She served as Chief Financial Officer for Boxlight Corporation (Nasdaq: BOXL), a global education technology provider, from September 2014 to March 2018. She was Chief Financial Officer at Logical Choice Technologies, Inc., a distributor of interactive technologies to the education market, from 2005 to 2013. Ms. Lofgren is a Certified Public Accountant with extensive experience in financial accounting and management, operational improvement, budgeting and cost control, cash management and treasury, along with broad audit experience, internal control knowledge and internal and external reporting. She started her career with KPMG and then joined Tarica and Whittemore, an Atlanta based CPA firm, as an audit manager. Ms. Lofgren is a graduate of Georgia State University where she earned a B.A. in Business Administration – Accounting.
Greg Butterfield
Greg Butterfield was appointed as an independent director of the Company on November 28, 2018. Mr. Butterfield is the founder and Managing Partner of SageCreek Partners (“SCP”) a technology commercialization and consulting firm. Prior to starting SCP Mr. Butterfield served as the CEO of Vivint Solar, a leading full-service residential solar integrator. Before Vivint, Mr. Butterfield was the Group President for Symantec’s Server and Storage business units. Mr. Butterfield joined Symantec through the company’s acquisition of Altiris in April 2007. At Altiris, he served as chairman of the board, President, and CEO starting in February 2000. Mr. Butterfield is widely credited as the driving force behind eleven acquisitions and navigated the company through a successful IPO in 2002 in spite of a notable economic downturn in the technology sector. The IPO was followed in August of 2003 with a successful secondary offering. Mr. Butterfield was invited to the 2006 World Economic Forum as a Technology Pioneer. He was also the winner of the 2002 Ernst and Young Entrepreneur of the Year award and served as the chairman of the board of the Utah Information Technology Association from 2003 to 2005. Mr. Butterfield received a Bachelor of Science in Business Administration (finance emphasis) from Brigham Young University.
| 56 |
Carine Clark
Carine Clark was appointed as an independent director of the Company on June 8, 2018. Ms. Clark has served as president and CEO of four high-growth tech companies. In March 2019, Ms. Clark was appointed to the board of directors of Domo, Inc. (NASDAQGM: DOMO) and is currently serving as a member of Domo’s compensation committee. Since 2017 she has served as an Executive Board Member of the Utah Governor’s Office of Economic Development and Silicon Slopes, a non-profit helping Utah’s tech community thrive. Prior to that, Ms. Clark served from January 2015 to December 2016 as the President and CEO of MartizCX. From December 2012 to December 2016, Ms. Clark served as the President and CEO of Allegiance, Inc. Her reputation as a data-driven marketing executive at Novell for 14 years, Altiris for five years, and Symantec for more than 10 years. She has received numerous awards including the EY Entrepreneur of The Year® Award in the Utah Region and Utah Business Magazine’s CEO of the Year. Ms. Clark earned a bachelor’s degree in organizational communications and an MBA from Brigham Young University.
Corporate Governance
Our Board of Directors currently consists of seven members. Our Chairperson of the Board of Directors is Dr. Edward Lee. Dr. Edward Lee, Dr. Desheng Wang and Dr. Jennifer Gu are the three members of our Board of Directors who are not independent directors. Michael Pope, Sheri Lofgren, Greg Butterfield, and Carine Clark are four members of our Board of Directors who are independent directors.
Director Attendance at Meetings
Our Board of Directors conducts its business through meetings, both in person and telephonic, and by actions taken by written consent in lieu of meetings. During the year ended December 31, 2021, our Board of Directors held four meetings. All directors attended at least 75% of the meetings of our Board of Directors and of the committees of our Board of Directors on which they served during 2021.
Our Board of Directors encourages all directors to attend our annual meetings of stockholders unless it is not reasonably practicable for a director to do so.
Committees of our Board of Directors
Our Board of Directors has established and delegated certain responsibilities to its standing Audit Committee, Compensation Committee and Nominating and Corporate Governance Committee.
Audit Committee
We have a separately designated standing Audit Committee established in accordance with Section 3(a)(58)(A) of the Exchange Act. The Audit Committee’s primary duties and responsibilities include monitoring the integrity of our financial statements, monitoring the independence and performance of our external auditors, and monitoring our compliance with applicable legal and regulatory requirements. The functions of the Audit Committee also include reviewing periodically with our independent registered public accounting firm the performance of the services for which they are engaged, including reviewing the scope of the annual audit and its results, reviewing with management and the auditors the adequacy of our internal accounting controls, reviewing with management and the auditors the financial results prior to the filing of quarterly and annual reports, reviewing fees charged by our independent registered public accounting firm and reviewing any transactions between our Company and related parties. Our independent registered public accounting firm reports directly and is accountable solely to the Audit Committee. The Audit Committee has the sole authority to hire and fire the independent registered public accounting firm and is responsible for the oversight of the performance of their duties, including ensuring the independence of the independent registered public accounting firm. The Audit Committee also approves in advance the retention of, and all fees to be paid to, the independent registered public accounting firm. The rendering of any auditing services and all non-auditing services by the independent registered public accounting firm is subject to prior approval of the Audit Committee.
The Audit Committee operates under a written charter. The Audit Committee is required to be composed of directors who are independent under the rules of the SEC and the listing standards of The NASDAQ Stock Market LLC (“NASDAQ”).
| 57 |
The current members of the Audit Committee are directors Ms. Sheri Lofgren, the Chairperson of the Audit Committee, Mr. Michael Pope and Mr. Greg Butterfield, all of whom have been determined by the Board of Directors to be independent under the NASDAQ listing standards and rules adopted by the SEC applicable to audit committee members. The Board of Directors has determined that Mr. Sheri Lofgren qualifies as an “audit committee financial expert” under the rules adopted by the SEC and the Sarbanes-Oxley Act. The Audit Committee met four times during 2021.
Compensation Committee
The primary duties and responsibilities of our standing Compensation Committee are to review, modify and approve the overall compensation policies for the Company, including the compensation of the Company’s Chief Executive Officer and other senior management; establish and assess the adequacy of director compensation; and approve the adoption, amendment and termination of the Company’s stock option plans, pension and profit-sharing plans, bonus plans and similar programs. The Compensation Committee may delegate to one or more officers the authority to make grants of options and restricted stock to eligible individuals other than officers and directors, subject to certain limitations. Additionally, the Compensation Committee has the authority to form subcommittees and to delegate authority to any such subcommittee. The Compensation Committee also has the authority, in its sole discretion, to select, retain and obtain, at the expense of the Company, advice and assistance from internal or external legal, accounting or other advisors and consultants. Moreover, the Compensation Committee has sole authority to retain and terminate any compensation consultant to assist in the evaluation of director, Chief Executive Officer or senior executive compensation, including sole authority to approve such consultant’s reasonable fees and other retention terms, all at the Company’s expense.
The Compensation Committee operates under a written charter. All members of the Compensation Committee must satisfy the independence requirements of NASDAQ applicable to compensation committee members.
The Compensation Committee currently consists of directors Ms. Carine Clark, Mr. Greg Butterfield, and Mr. Sheri Lofgren. Ms. Carine Clark is the Chairperson of the Compensation Committee. Each of the Compensation Committee members has been determined by the Board of Directors to be independent under NASDAQ listing standards applicable to compensation committee members. The Compensation Committee met four times during 2021.
Nominating and Corporate Governance Committee
The Nominating and Corporate Governance Committee identifies, reviews and evaluates candidates to serve on the Board; reviews and assesses the performance of the Board of Directors and the committees of the Board; and assesses the independence of our directors. The Nominating and Corporate Governance Committee is also responsible for reviewing the composition of the Board’s committees and making recommendations to the entire Board of Directors regarding the chairpersonship and membership of each committee. In addition, the Nominating and Corporate Governance Committee is responsible for developing corporate governance principles and periodically reviewing and assessing such principles, as well as periodically reviewing the Company’s policy statements to determine their adherence to the Company’s Code of Business Conduct and Ethics.
The Nominating and Corporate Governance Committee has adopted a charter that identifies the procedures whereby Board of Director candidates are identified primarily through suggestions made by directors, management and stockholders of the Company. We have implemented no material changes in the past year to the procedures by which stockholders may recommend nominees for the Board. The Nominating and Corporate Governance Committee will consider director nominees recommended by stockholders that are submitted in writing to the Company’s Corporate Secretary in a timely manner and which provide necessary biographical and business experience information regarding the nominee. The Nominating and Corporate Governance Committee does not intend to alter the manner in which it evaluates candidates, including the criteria considered by the Nominating Committee, based on whether or not the candidate was recommended by a stockholder. The Board of Directors does not prescribe any minimum qualifications for director candidates, and all candidates for director will be evaluated based on their qualifications, diversity, age, skill and such other factors as deemed appropriate by the Nominating and Corporate Governance Committee given the current needs of the Board of Directors, the committees of the Board of Directors and the Company. Although the Nominating and Corporate Governance Committee does not have a specific policy on diversity, it considers the criteria noted above in selecting nominees for directors, including members from diverse backgrounds who combine a broad spectrum of experience and expertise. Absent other factors which may be material to its evaluation of a candidate, the Nominating and Corporate Governance Committee expects to recommend to the Board of Directors for selection incumbent directors who express an interest in continuing to serve on the Board. Following its evaluation of a proposed director’s candidacy, the Nominating and Corporate Governance Committee will make a recommendation as to whether the Board of Directors should nominate the proposed director candidate for election by the stockholders of the Company.
| 58 |
The Nominating and Corporate Governance Committee operates under a written charter. No member of the Nominating and Corporate Governance Committee may be an employee of the Company, and each member must satisfy the independence requirements of NASDAQ and the SEC.
The Nominating and Corporate Governance Committee currently consists of directors Mr. Greg Butterfield, who is the Chairperson of the committee, Mr. Michael Pope and Ms. Carine Clark. Each of the members of the Nominating and Corporate Governance Committee has been determined by the Board of Directors to be independent under NASDAQ listing standards. The Nominating and Corporate Governance Committee met four times in 2021.
Oversight of Risk Management
Risk is inherent with every business, and how well a business manages risk can ultimately determine its success. We face a number of risks, including economic risks, financial risks, legal and regulatory risks and others, such as the impact of competition. Management is responsible for the day-to-day management of the risks that we face, while our Board, as a whole and through its committees, has responsibility for the oversight of risk management. In its risk oversight role, our Board of Directors is responsible for satisfying itself that the risk management processes designed and implemented by management are adequate and functioning as designed. Our Board of Directors assesses major risks facing our Company and options for their mitigation in order to promote our stockholders’ interests in the long-term health of our Company and our overall success and financial strength. A fundamental part of risk management is not only understanding the risks a company faces and what steps management is taking to manage those risks, but also understanding what level of risk is appropriate for us. The involvement of our full Board of Directors in the risk oversight process allows our Board of Directors to assess management’s appetite for risk and also determine what constitutes an appropriate level of risk for our Company. Our Board of Directors regularly includes agenda items at its meetings relating to its risk oversight role and meets with various members of management on a range of topics, including corporate governance and regulatory obligations, operations and significant transactions, risk management, insurance, pending and threatened litigation and significant commercial disputes.
While our Board of Directors is ultimately responsible for risk oversight, various committees of our Board of Directors oversee risk management in their respective areas and regularly report on their activities to our entire Board of Directors. In particular, the Audit Committee has the primary responsibility for the oversight of financial risks facing our Company. The Audit Committee’s charter provides that it will discuss our major financial risk exposures and the steps we have taken to monitor and control such exposures. Our Board of Directors has also delegated primary responsibility for the oversight of all executive compensation and our employee benefit programs to the Compensation Committee. The Compensation Committee strives to create incentives that encourage a level of risk-taking behavior consistent with our business strategy.
We believe the division of risk management responsibilities described above is an effective approach for addressing the risks facing our Company and that our Board’s leadership structure provides appropriate checks and balances against undue risk taking.
Code of Business Conduct and Ethics
Our Board of Directors has adopted a code of ethical conduct that applies to our principal executive officer, principal financial officer and senior financial management. This code of ethical conduct is embodied within our Code of Business Conduct and Ethics, which applies to all persons associated with our Company, including our directors, officers and employees (including our principal executive officer, principal financial officer, principal accounting officer and controller). In order to satisfy our disclosure requirements under Item 5.05 of Form 8-K, we will disclose amendments to, or waivers of, certain provisions of our Code of Business Conduct and Ethics relating to our chief executive officer, chief financial officer, chief accounting officer, controller or persons performing similar functions on our website promptly following the adoption of any such amendment or waiver. The Code of Business Conduct and Ethics provides that any waivers of, or changes to, the code that apply to the Company’s executive officers or directors may be made only by the Audit Committee. In addition, the Code of Business Conduct and Ethics includes updated procedures for non-executive officer employees to seek waivers of the code.
| 59 |
Director Independence
Our Company is governed by our Board. Currently, each member of our Board, other than Dr. Edward Lee, Dr. Desheng Wang, and Dr. Jennifer Gu, is an independent director; and all standing committees of our Board of Directors are composed entirely of independent directors, in each case under NASDAQ’s independence definition applicable to boards of directors. For a director to be considered independent, our Board of Directors must determine that the director has no relationship which, in the opinion of our Board, would interfere with the exercise of independent judgment in carrying out the responsibilities of a director. Members of the Audit Committee also must satisfy a separate SEC independence requirement, which provides that they may not accept directly or indirectly any consulting, advisory or other compensatory fee from us or any of our subsidiaries other than their directors’ compensation. In addition, under SEC rules, an Audit Committee member who is an affiliate of the issuer (other than through service as a director) cannot be deemed to be independent. In determining the independence of members of the Compensation Committee, NASDAQ listing standards require our Board of Directors to consider certain factors, including, but not limited to: (1) the source of compensation of the director, including any consulting, advisory or other compensatory fee paid by us to the director, and (2) whether the director is affiliated with us, one of our subsidiaries or an affiliate of one of our subsidiaries. Under our Compensation Committee Charter, members of the Compensation Committee also must qualify as “outside directors” for purposes of Section 162(m) of the Internal Revenue Code of 1986, as amended (the “Code”), and as “non-employee directors” for purposes of Rule 16b-3 under the Exchange Act. The independent members of the Board of Directors are Michael Pope, Sheri Lofgren, Greg Butterfield, and Carine Clark.
Item 11: EXECUTIVE COMPENSATION
Compensation of Officers
The following summary compensation table sets forth information concerning compensation for services rendered in all capacities during 2021, and 2020 awarded to, earned by or paid to our executive officers.
Summary Compensation Table
| (a) | (b) | (c) | (d) | (e) | (f) | (g) | (h) | (i) | (j) | |||||||||||||||||||||||||||
| Name and Principal | Salary | Bonus | Stock Awards | Option Awards | Non-Equity Incentive Plan Compensation | Change in Pension Value & Non-qualified Deferred Compensation Earnings | All Other Compensation | Totals | ||||||||||||||||||||||||||||
| Position | Year | ($)* | ($) | ($) | ($) | (S) | ($) | ($) | ($) | |||||||||||||||||||||||||||
| Desheng Wang | 2021 | 124,615 | 0 | 0 | 0 | 0 | 0 | 0 | 124,615 | |||||||||||||||||||||||||||
| CEO, Secretary and Director | 2020 | 120,000 | 0 | 0 | 0 | 0 | 0 | 0 | 120,000 | |||||||||||||||||||||||||||
| Duncan Lee | 2021 | 21,700 | 0 | 0 | 0 | 0 | 0 | 0 | 21,700 | |||||||||||||||||||||||||||
| Chief Financial Officer | 2020 | 22,100 | 0 | 0 | 0 | 0 | 0 | 0 | 22,100 | |||||||||||||||||||||||||||
| 60 |
Narrative Disclosure Requirement for Summary Compensation Table
Compensation
Dr. Desheng Wang entered into an employment agreement with the Company whereby the Company agreed to pay Dr. Wang a salary of $124,615 per year, payable monthly, for his services as Chief Executive Officer, effective as of November 1, 2018. We have not provided our other named executive officers with perquisites or other personal benefits. Duncan Lee was hired in April 2018 to serve as Chief Financial Officer. Mr. Lee received $22,100 in compensation in 2020 and $21,700 in 2021. As of the date of this report, no other officer or director has formally entered into any compensation arrangement for services provided under consulting agreements or employment agreements.
Retirement, Resignation or Termination Plans
We sponsor no plan, whether written or verbal, that would provide compensation or benefits of any type to an executive upon retirement, or any plan that would provide payment for retirement, resignation, or termination as a result of a change in control of our company or as a result of a change in the responsibilities of an executive following a change in control of our company.
Directors’ Compensation
The persons who served as affiliated members of our Board of Directors, including executive officers, did not receive any compensation for services as directors in 2020 or 2021. As of the date of this report, no director has formally entered into any compensation arrangement for services provided under consulting agreements or employment agreements.
As of the date of this annual report, all directors have been issued 60,000 options per person pursuant to our 2018 Stock Option Plan and such options will vest over a period of one year. In 2020 and 2021, all independent directors were paid $20,000 cash, except for Sheri Lofgren, who received $25,000 for serving as the chair of the audit committee. Additionally, a company affiliated with Mr. Pope received $120,000 for advisory services in 2020, which included $72,000 in cash and $48,000 in stock, and $120,000 for advisory services in 2021, which included $72,000 in cash and $48,000 in stock.
Option Exercises and Stock Vested
On December 17, 2018, the Company adopted the 2018 Stock Option Plan (the “2018 Stock Option Plan”) whereby the Company reserved for issuance 1,000,000 shares of common stock and agreed that such shares shall, when issued and paid for in accordance with the provisions of the 2018 Stock Option Plan, constitute validly issued, fully paid and non-assessable shares of common stock.
Pension Benefits and Nonqualified Deferred Compensation
The Company does not maintain any qualified retirement plans or non-nonqualified deferred compensation plans for its employees or directors.
| 61 |
Executive Officer Outstanding Equity Awards at Fiscal Year-End
The following table provides certain information concerning any common share purchase options, stock awards or equity incentive plan awards held by each of our named executive officers that were outstanding as of December 31, 2021.
| Option Awards | Stock Awards | |||||||||||||||||||||||||||||||||||
Number of Securities Underlying Unexercised Options (#) | Number of Securities Underlying Unexercised Options (#) | Equity Incentive Plan Awards: Number of Securities Underlying Unexercised Unearned | Option Exercise Price | Option Expiration | Number of Shares or Units of Stock That Have Not Vested | Market Value of Shares or Units of Stock That Have Not | Equity Incentive Plan Awards: Number of Unearned Shares, Units or Other Rights That Have Not | Equity Incentive Plan Awards: Market or Payout Value of Unearned Shares, Units or Other Rights That Have Not | ||||||||||||||||||||||||||||
| Name | Exercisable | Unexercisable | Options (#) | ($) | Date | (#) | Vested | Vested | Vested | |||||||||||||||||||||||||||
| Edward Lee - Chairman | 30,000 | – | – | $ | 5.70 | August 6, 2029 | – | – | – | – | ||||||||||||||||||||||||||
| 15,000 | – | – | $ | 3.00 | December 10, 2030 | – | – | – | – | |||||||||||||||||||||||||||
| – | 15,000 | – | $ | 8.86 | December 30, 2031 | – | – | – | – | |||||||||||||||||||||||||||
| Desheng Wang - CEO, Secretary | 30,000 | – | – | $ | 5.70 | August 6, 2029 | – | – | – | – | ||||||||||||||||||||||||||
| 15,000 | – | – | $ | 3.00 | December 10, 2030 | – | – | – | – | |||||||||||||||||||||||||||
| – | 15,000 | – | $ | 8.86 | December 30, 2031 | – | – | – | – | |||||||||||||||||||||||||||
| Duncan Lee - CFO | – | – | – | – | – | – | – | – | – | |||||||||||||||||||||||||||
| Jennifer Gu | 30,000 | – | – | $ | 5.70 | August 6, 2029 | – | – | – | – | ||||||||||||||||||||||||||
| 15,000 | – | – | $ | 3.00 | December 10, 2030 | – | – | – | – | |||||||||||||||||||||||||||
| – | 15,000 | – | $ | 8.86 | December 30, 2031 | – | – | – | – | |||||||||||||||||||||||||||
| Michael Pope | 30,000 | – | – | $ | 5.70 | August 6, 2029 | – | – | – | – | ||||||||||||||||||||||||||
| 15,000 | – | – | $ | 3.00 | December 10, 2030 | – | – | – | – | |||||||||||||||||||||||||||
| – | 15,000 | – | $ | 8.86 | December 30, 2031 | – | – | – | – | |||||||||||||||||||||||||||
| Carine Clark | 30,000 | – | – | $ | 5.70 | August 6, 2029 | – | – | – | – | ||||||||||||||||||||||||||
| 15,000 | – | – | $ | 3.00 | December 10, 2030 | – | – | – | – | |||||||||||||||||||||||||||
| – | 15,000 | – | $ | 8.86 | December 30, 2031 | – | – | – | – | |||||||||||||||||||||||||||
| Sheri Lofgren | 30,000 | – | – | $ | 5.70 | August 6, 2029 | – | – | – | – | ||||||||||||||||||||||||||
| 15,000 | – | – | $ | 3.00 | December 10, 2030 | – | – | – | – | |||||||||||||||||||||||||||
| – | 15,000 | – | $ | 8.86 | December 30, 2031 | – | – | – | – | |||||||||||||||||||||||||||
| Greg Butterfield | 30,000 | – | – | $ | 5.70 | August 6, 2029 | – | – | – | – | ||||||||||||||||||||||||||
| 15,000 | – | – | $ | 3.00 | December 10, 2030 | – | – | – | – | |||||||||||||||||||||||||||
| – | 15,000 | – | $ | 8.86 | December 30, 2031 | – | – | – | – | |||||||||||||||||||||||||||
| 62 |
Item 12. SECURITY OWNERSHIP OF CERTAIN BENEFICIAL OWNERS AND MANAGEMENT AND RELATED STOCKHOLDER MATTERS
The following table sets forth certain information regarding beneficial ownership of our common stock as of December 31, 2021: (i) by each of our directors, (ii) by each of the Named Executive Officers, (iii) by all of our executive officers and directors as a group, and (iv) by each person or entity known by us to beneficially own more than five percent (5%) of any class of our outstanding shares. As of December 31, 2021, there were 26,294,129 shares of our common stock outstanding:
| Title of Class | Name of Beneficial Owner |
Amount and (1) |
Percentage of % |
||||||||
| Common | Desheng Wang, CEO, and Director | 14,393,700 | 33.273% | ||||||||
| Common | Edward Lee, Chairman and Director jointly with Jennifer Gu, Director | 8,276,000 | 19.131% | ||||||||
| Common | Yan Chen | 2,983,561 | 6.897% | ||||||||
| Common | Michael Pope | 55,907 | (2) | * | |||||||
| Common | Duncan Lee | 1,400 | * | ||||||||
(1) Applicable percentage of ownership is based on 43,259,741 shares of common stock outstanding on December 31, 2021.
(2) Shares held by a company affiliated with Mr. Pope
Percentage ownership is determined based on shares owned together with securities exercisable or convertible into shares of common stock within 60 days of December 31, 2021, for each stockholder. Beneficial ownership is determined in accordance with the rules of the SEC and generally includes voting or investment power with respect to securities. Shares of common stock subject to securities exercisable or convertible into shares of common stock that are currently exercisable or exercisable within 60 days of December 31, 2021, are deemed to be beneficially owned by the person holding such securities for the purpose of computing the percentage of ownership of such person, but are not treated as outstanding for the purpose of computing the percentage ownership of any other person. Our common stock is our only issued and outstanding class of securities eligible to vote.
As of December 31, 2021, there were 25,710,568 shares of common stock outstanding owned by our officers and directors.
Item 13. CERTAIN RELATIONSHIPS AND RELATED TRANSACTIONS, AND DIRECTOR INDEPENDENCE
Consulting services provided by the President, Chief Executive Officer, Secretary, Treasurer and Chief Financial Officer for the years ended December 31, 2021 and 2020 were as follows:
For the Ended December 31, 2021 | For the Ended December 31, | |||||||
| President | $ | 0 | $ | 0 | ||||
| Chief Executive Officer, Secretary and Treasurer | 124,615 | 120,000 | ||||||
| Chief Financial Officer | 21,700 | 22,100 | ||||||
| $ | 146,315 | $ | 142,100 | |||||
| 63 |
Advances to (from) related party
Revenue generated from Vitashower Corp., a company owned by the CEO’s wife, amounted to $29,084 and $26,449 for the year ended December 31, 2021 and 2020, respectively. Account receivable balance due from Vitashower Corp. amounted to $15,176 and $0 as of December 31, 2021 and 2020, respectively. Purchases generated from Vitashower Corp. amounted to $3,379 and $0 for the years ended December 31, 2021 and 2020, respectively. There were accounts payable balances of $0 and $17,371 due to Vitashower Corp. as of December 31, 2021 and 2020, respectively.
Director Independence
A director is not considered to be independent if he or she is also an executive officer or employee of the corporation. Our director Edward Lee is also our Chairman; our director Desheng Wang is also our Chief Executive Officer. The rest of our directors, excluding Jennifer Gu, are considered to be independent directors.
Item 14. PRINCIPAL ACCOUNTING FEES AND SERVICES
During the year ended March 31, 2015, 2014, and the period from December 4, 2012 (Inception) to March 31, 2013, we engaged Cutler & Co, LLC, as our independent auditor. On October 20, 2015, we changed our independent auditor to DYH & Company. On April 16, 2017, we changed our independent auditor to BF Borgers CPA PC. For the years ended December 31, 2021 and 2020, we incurred fees as discussed below:
| Year ended December 31, 2021 |
Year ended December 31, 2020 |
||||||||
| Audit fees | $ | 128,000 | $ | 106,598 | |||||
| Audit – related fees | $ | Nil | $ | Nil | |||||
| Tax fees | $ | Nil | $ | Nil | |||||
| All other fees | $ | Nil | $ | Nil | |||||
Audit fees consist of fees related to professional services rendered in connection with the audit of our annual financial statements and review of our quarterly financial statements. Tax fees represent fees related to preparation of our corporation income tax returns. Our policy is to pre-approve all audit and permissible non-audit services performed by the independent accountants. These services may include audit services, audit-related services, tax services and other services.
| 64 |
PART IV
Item 15. EXHIBITS
| EXHIBIT NUMBER | DESCRIPTION | |
| 3.1 | Articles of Incorporation, as filed with the SEC on December 26, 2013. | |
| 3.2 | Amended and Restated Bylaws, as filed with the SEC on October 22, 2019. | |
| 4.2 | Subscription Agreement, as filed with the SEC on December 26, 2013. | |
| 10.1 | Form of Stock Purchase Agreement, as filed with the SEC on March 18, 2019. | |
| 10.2 | Form of Secured Promissory Note, as filed with the SEC on March 18, 2019. | |
| 10.3 | Form of Stock Pledge Agreement, as filed with the SEC on March 18, 2019. | |
| 10.4 | Form of Subscription Agreement, as filed with the SEC on March 18, 2019. | |
| 10.5 | Form of Consulting Agreement, as filed with the SEC on March 18, 2019. | |
| 10.7 | 2018 Equity Incentive Plan, as filed with the SEC on December 28, 2018. | |
| 10.8 | Promissory Note with Chase Bank, dated March 10, 2021 for $108,750 SBA Loan, as filed with the SEC on March 23, 2021. | |
| 10.9 | Secured Promissory Note with East West Bank, dated January 8, 2021 for $1,500,000, as filed with the SEC on March 23, 2021. | |
| 10.10 | Loan Agreement with Golden Sunrise Investment LLC, dated March 15, 2021 for $1,500,000, as filed with the SEC on March 23, 2021. | |
| 10.11 | Company Guarantee Agreement with Golden Sunrise Investment LLC, dated March 15, 2021, as filed with the SEC on March 23, 2021. | |
| 10.12 | Secured Promissory Note with Golden Sunrise Investment LLC, dated March 15, 2021 for $1,500,000, as filed with the SEC on March 23, 2021. | |
| 31.1 | Certification of the Chief Executive Officer pursuant to Rules 13a-14(a) and 15d-14(a), as adopted pursuant to Section 302 of the Sarbanes-Oxley Act of 2002.* | |
| 31.2 | Certification of the Chief Financial Officer pursuant to Rules 13a-14(a) and 15d-14(a), as adopted pursuant to Section 302 of the Sarbanes-Oxley Act of 2002.* | |
| 32.1 | Certification of the Chief Executive Officer pursuant to 18 U.S.C Section 1350, as adopted pursuant to Section 906 of the Sarbanes-Oxley Act of 2002.* | |
| 32.2 | Certification of the Chief Financial Officer pursuant to 18 U.S.C Section 1350, as adopted pursuant to Section 906 of the Sarbanes-Oxley Act of 2002.* | |
| 101.INS | Inline XBRL Instance Document (the instance document does not appear in the Interactive Data File because its XBRL tags are embedded within the Inline XBRL document)** | |
| 101.SCH | Inline XBRL Taxonomy Extension Schema Document** | |
| 101.CAL | Inline XBRL Taxonomy Extension Calculation Linkbase Document** | |
| 101.DEF | Inline XBRL Taxonomy Extension Definition Linkbase Document** | |
| 101.LAB | Inline XBRL Taxonomy Extension Label Linkbase Document** | |
| 101.PRE | Inline XBRL Taxonomy Extension Presentation Linkbase Document** | |
| 104 | Cover Page Interactive Data File (embedded within the Inline XBRL document) |
* Filed herewith.
** XBRL (Extensible Business Reporting Language) information is furnished and not filed or a part of a registration statement or prospectus for purposes of Sections 11 or 12 of the Securities Act of 1933, as amended, is deemed not filed for purposes of Section 18 of the Securities Exchange Act of 1934, as amended, and otherwise is not subject to liability under these sections.
Item 16. FORM 10-K SUMMARY
None.
| 65 |
SIGNATURES
Pursuant to the requirements of Section 13 or 15(d) of the Securities Exchange Act of 1934, the registrant has duly caused this report to be signed on its behalf by the undersigned, thereunto duly authorized.
Date: March 8, 2022
| FOCUS UNIVERSAL INC. | ||
| By: | /s/ Desheng Wang | |
| Desheng Wang | ||
| Chief Executive Officer, Secretary, and Director | ||
Pursuant to the requirements of the Securities Exchange Act of 1934, this report has been signed below by the following persons on behalf of the registrant and in the capacities and on the dates indicated.
| SIGNATURES | TITLE | DATE | ||
| /s/ Desheng Wang | Chief Executive Officer, Secretary and Director | March 8, 2022 | ||
| Desheng Wang | ||||
Focus Universal Inc., a Nevada corporation
/s/ Desheng Wang
By Desheng Wang, its CEO
| 66 |